iblocker/monitor
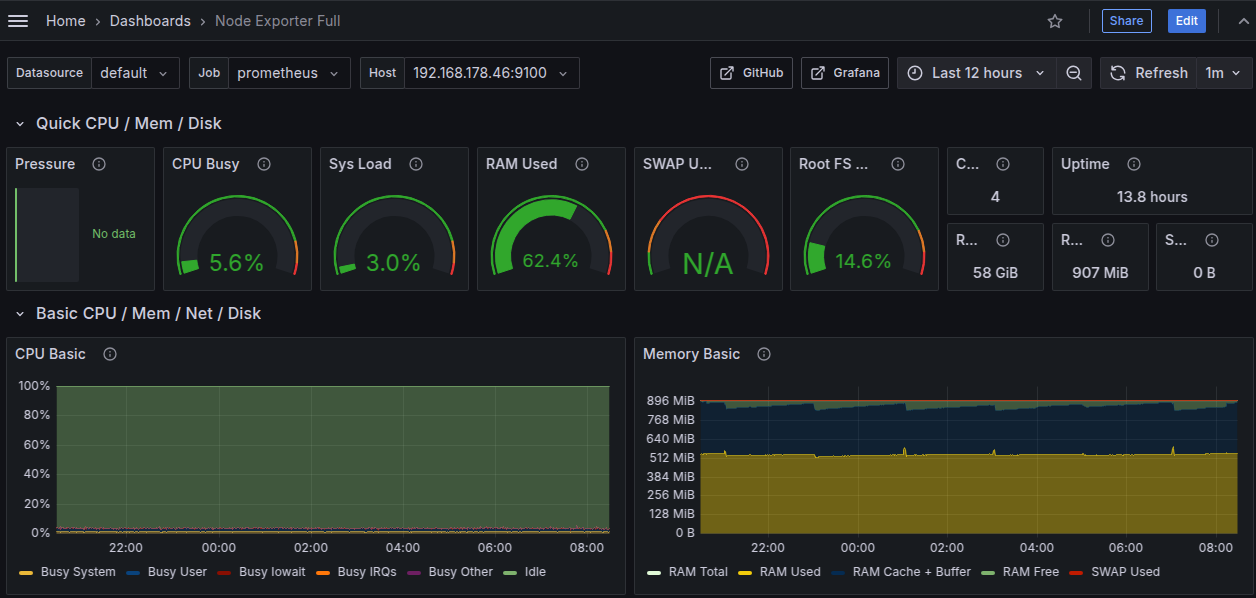
Monitor The image contains Prometheus und Grafana.
Image
0
1.1K
iblocker/monitor repository overview
The image is able to monitor devices from network segments 192.168.178.0/24 and 172.25.1.0/24, which could be adjusted in /opt/IB/prometheus.yml.
Then the Grafana Dashboards could be added in iBlocker: '''http://172.25.1.1:3000'''
Installation
services:
  monitor:
    image: iblocker/monitor:v2.0.4
    container_name: monitor
    privileged: true
    ports:
      - "9090:9090"
      - "3000:3000"
      - "9090:9090"
      - "9100:9100"
      - "9115:9115"
    volumes:
      - /opt/IB/grafana.ini:/etc/grafana.ini
      - /opt/IB/prometheus.yml:/etc/prometheus/prometheus.yml
      - /opt/IB/blackbox.yml:/etc/prometheus/blackbox.yml
      - /sys/fs/cgroup:/rootfs/sys/fs/cgroup
      - /etc/localtime:/etc/localtime:ro
      - /etc/timezone:/etc/timezone:ro
    restart: always
    uts: host
    logging:
      options:
        max-size: "100m"
    command:
    - "hostname"
    entrypoint: "./docker-entrypoint.sh"
Grafana.ini could be adjusted for alerts via email, as described here: https://github.com/iBlocker-eu/Quantum-SAFE-Video-Camera/wiki/iBlocker-MONITORING
Tag summary
Content type
Image
Digest
sha256:c7f6eb8bd…
Size
245.6 MB
Last updated
3 months ago
docker pull iblocker/monitor:v2.0.5