lifailon/logporter
A lightweight alternative to cAdvisor, log collector for sending to Lok, and searching for new image
100K+
lifailon/logporter repository overview

A lightweight alternative to 🦉 cAdvisor for exporting metrics from Docker containers, a log collector for sending to Lok, and searching for new image versions in remote registries based on semantic analysis of tags or digests in a single container.
Quick start
Clone the repository and run the monitoring full-stack with one command:
git clone https://github.com/Lifailon/logporter
cd logporter
docker-compose up -d --pull always
The stack includes Prometheus with an exporter connected and alerts configured, a Loki server targeted by a log collector, and Grafana with pre-configured data sources and added dashboards.
Go to Grafana UI: http://localhost:3000 and enter admin:admin.
Dashboard
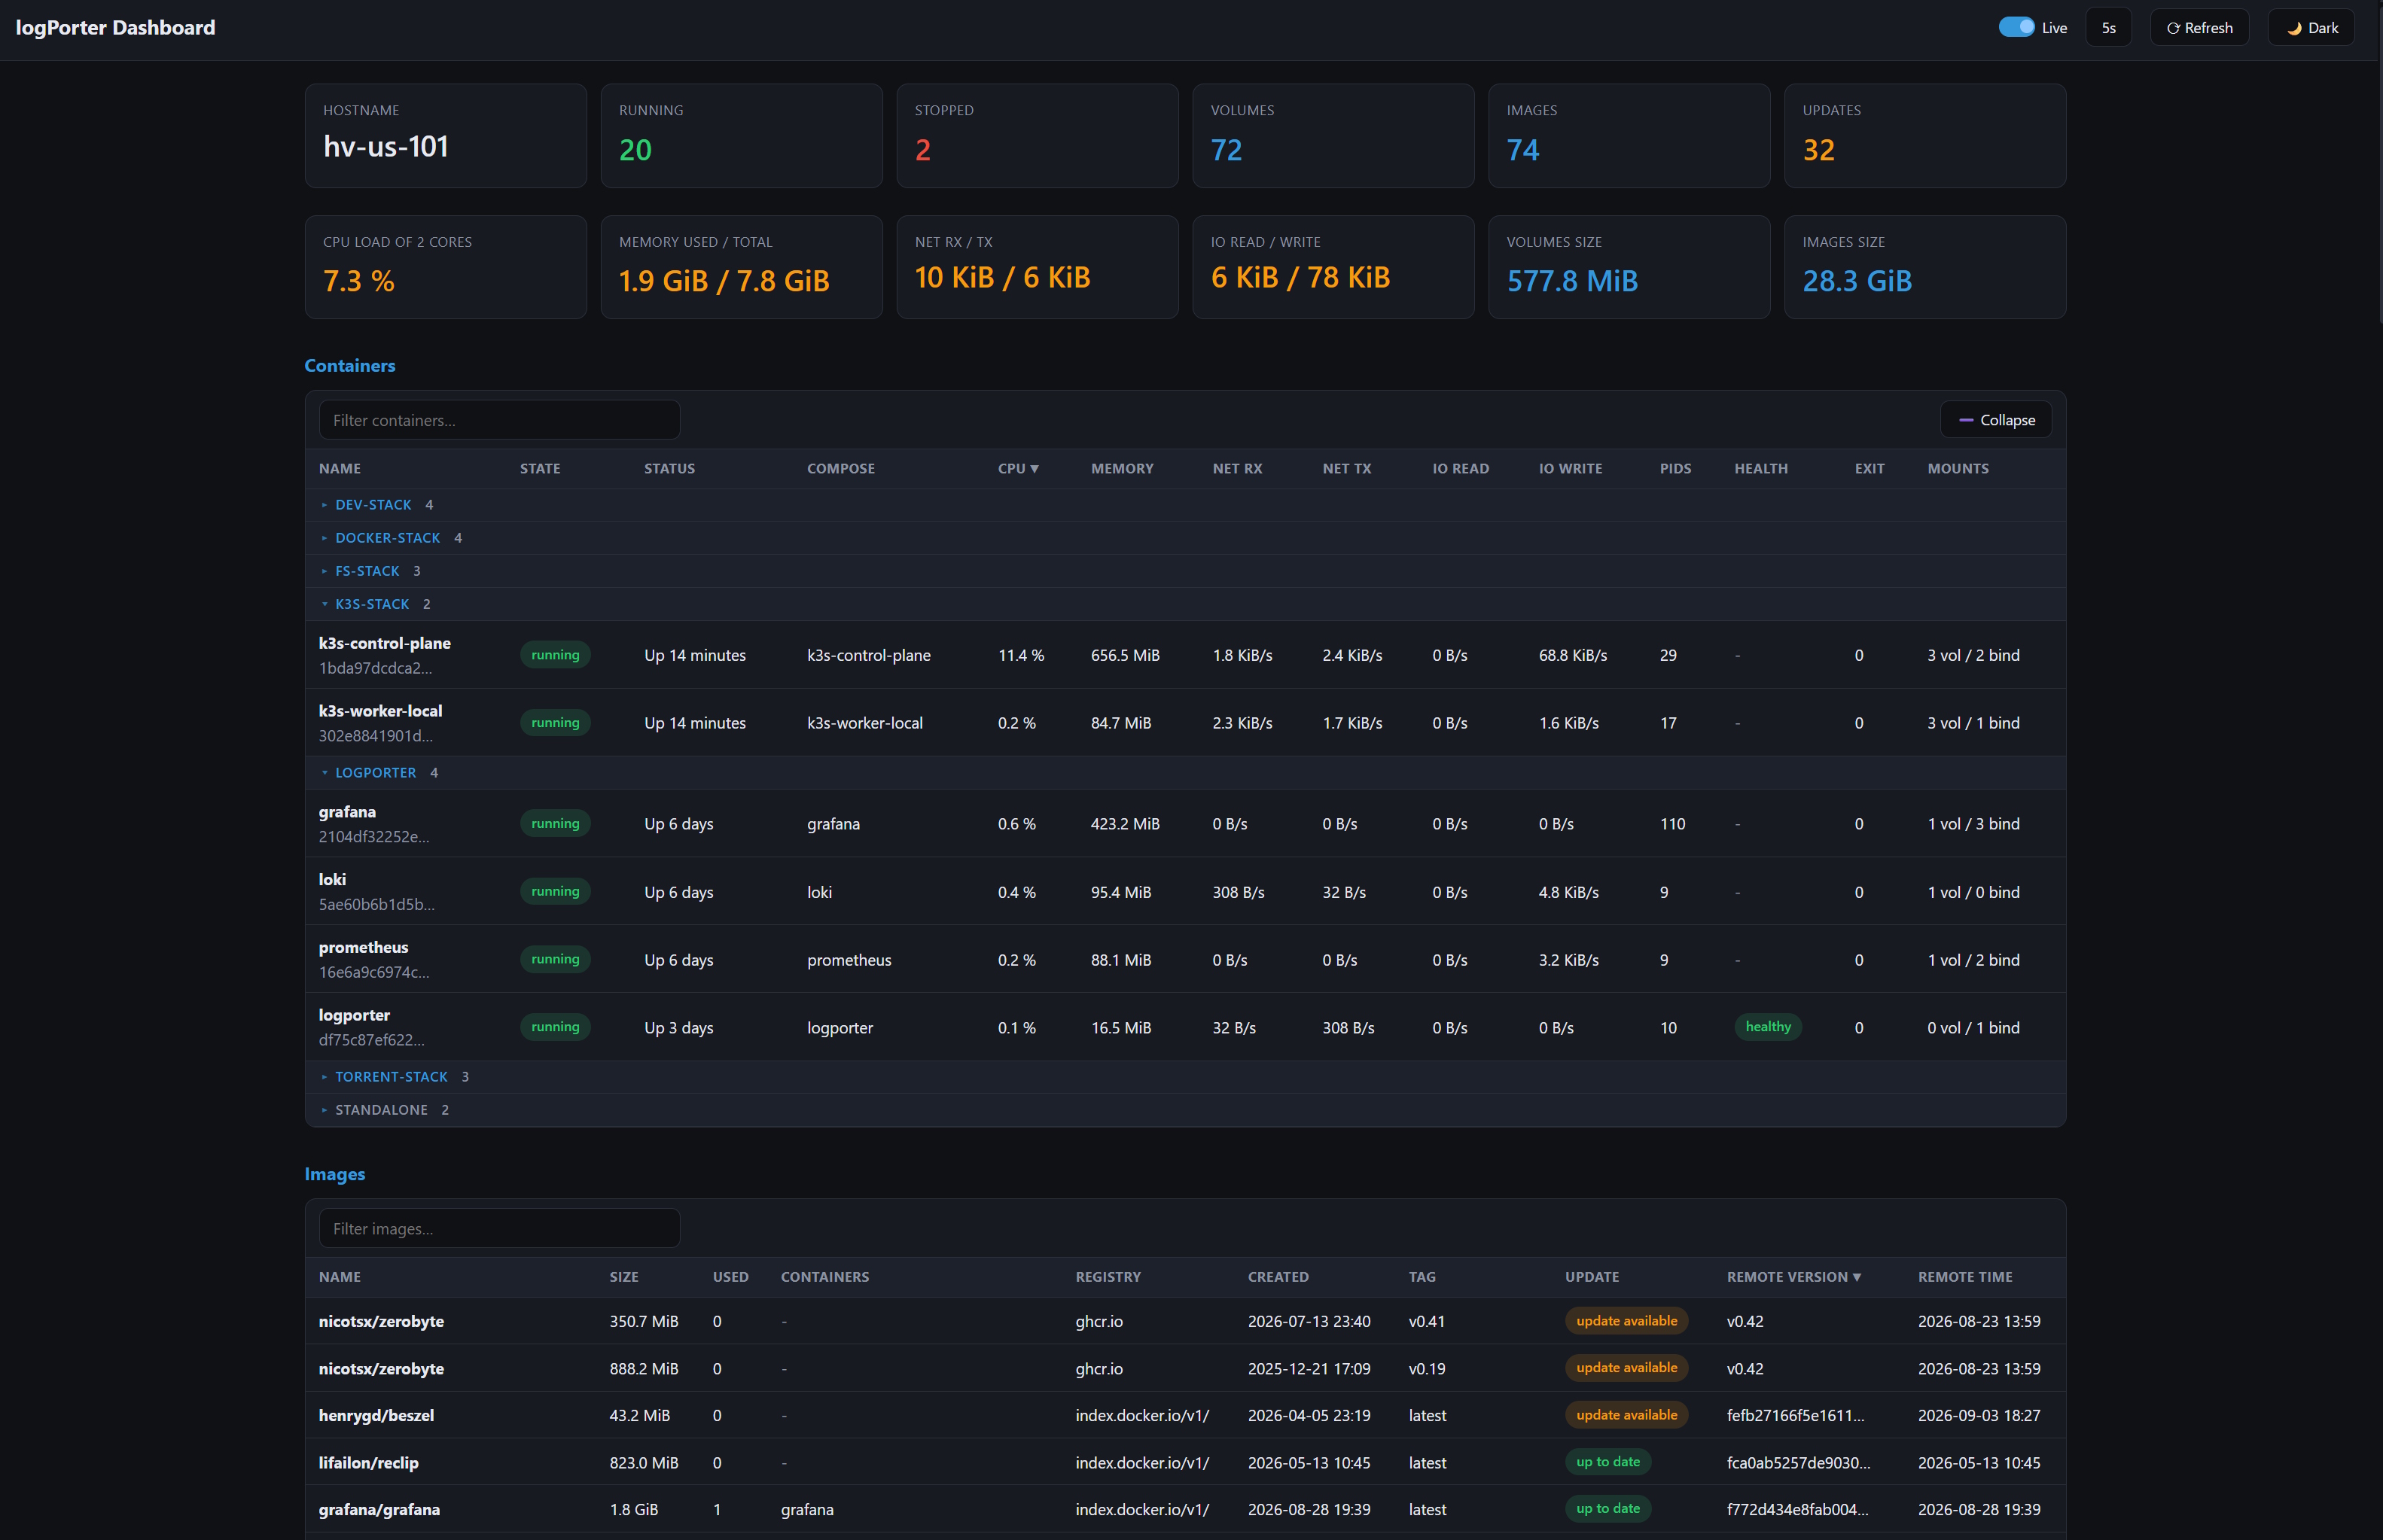
The project supports a built-in dashboard that contains summary information on the status of all containers, images, and volumes. The interface is based on go-template and does not affect performance in any way, as it uses cached data.
Go to Dashboard: http://localhost:9333.
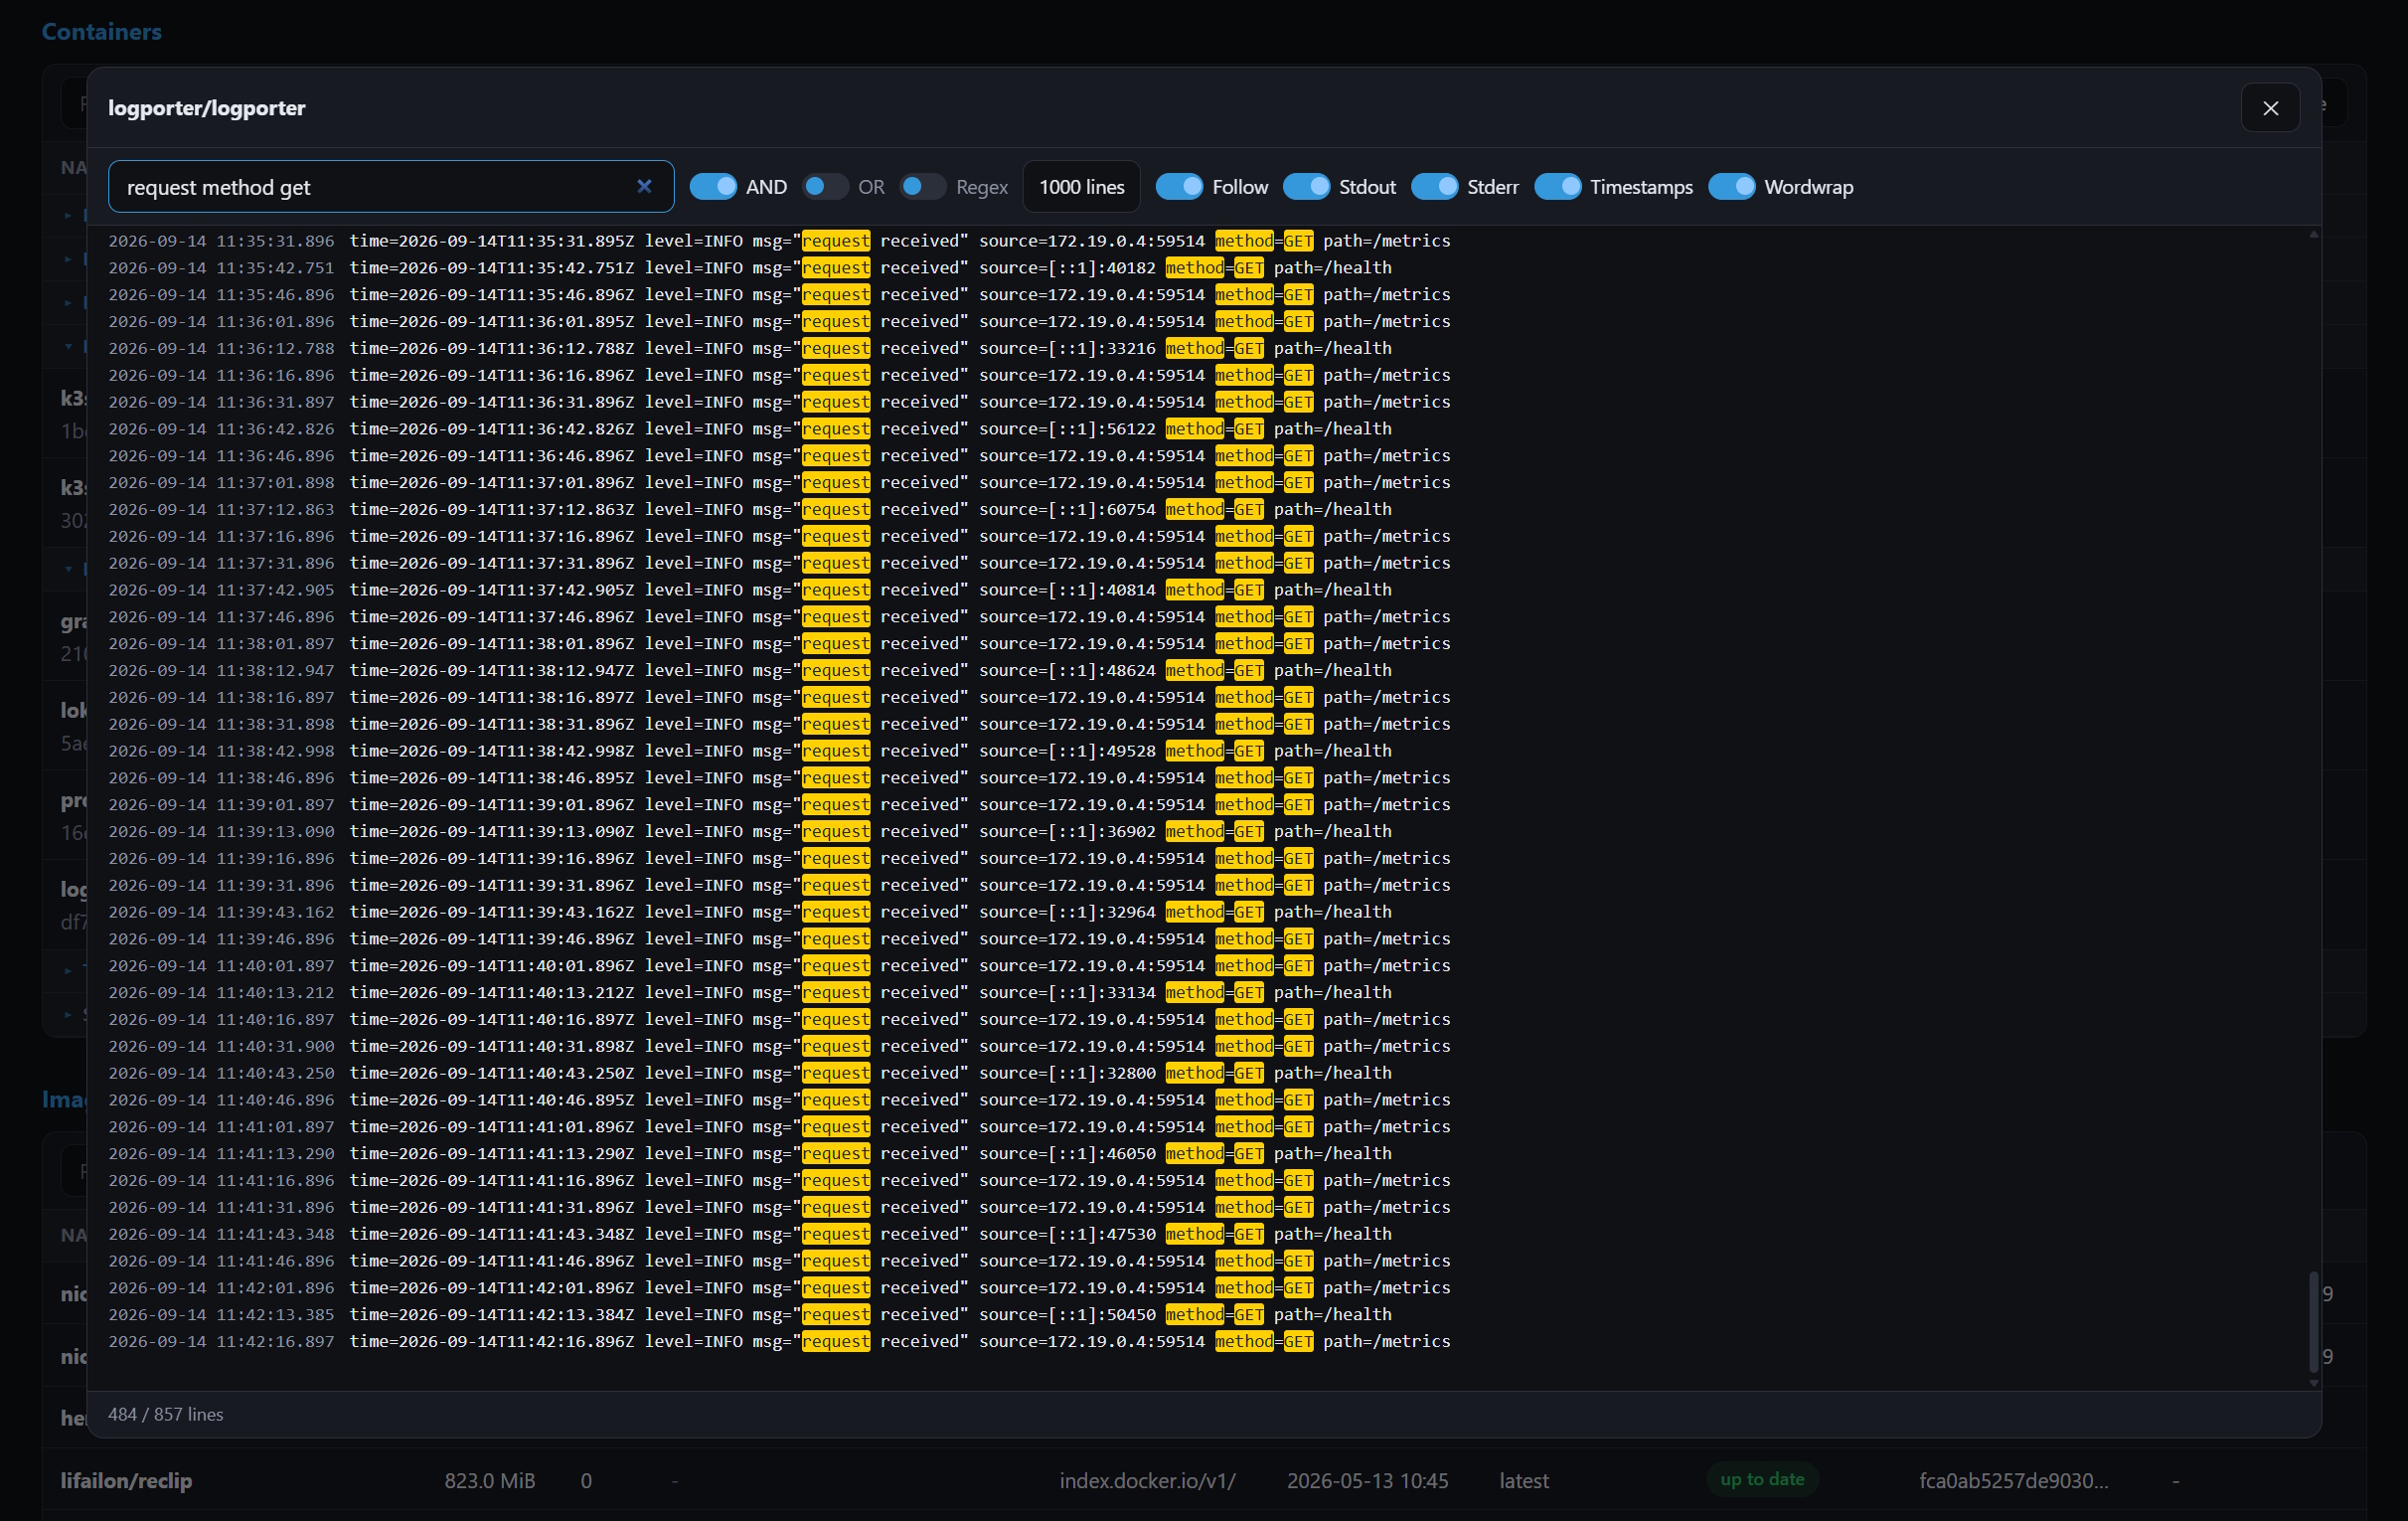
The dashboard allows you to view container logs in real time, with support for content filtering.
Manual setup
Exporter
- Run the exporter in a container using the image published on Docker Hub:
docker run -d --name logporter \
  -v /var/run/docker.sock:/var/run/docker.sock:ro \
  -p 9333:9333 \
  --restart=always \
  lifailon/logporter:latest
All metrics are retrieved directly from the Docker socket, which requires read-only access (:ro).
Or use compose to fine-tune access to the Docker socket through a proxy:
services:
  logporter:
    image: lifailon/logporter:latest
    container_name: logporter
    restart: always
    ports:
      - 9333:9333
    environment:
      - DOCKER_HOST=tcp://docker-proxy:2375

  docker-proxy:
    image: lscr.io/linuxserver/socket-proxy:latest
    container_name: docker-proxy
    restart: always
    environment:
      - CONTAINERS=1
      - INFO=1
      - SYSTEM=1
      - IMAGES=1
      - DISTRIBUTION=1
      - ALLOW_LOGS=1
    volumes:
      - /var/run/docker.sock:/var/run/docker.sock:ro
List of environment variables to configure:
| Label | Type | Default | Description |
|---|---|---|---|
LOG_LEVEL | string | info | Use debug to get detailed output of the exporter operation or error to suppress the output of info messages |
DOCKER_METRICS_PORT | int | 9333 | The port on which the exporter is listening |
DOCKER_METRICS_HOSTNAME | string | "" | Custom hostname displayed in Prometheus and Loki labels (by default from Docker API or OS) |
DOCKER_METRICS_CUSTOM_LABELS | string | "" | List of custom labels that will be added to all container metrics (only if present, e.g. org.opencontainers.image.version) |
DOCKER_METRICS_CACHE | int | 15 | Cache time for all collected metrics in seconds. Until the cache expires, queried metrics will return the last value received |
DOCKER_METRICS_VOLUME | boolean | true | Enable metrics collection for all volumes and their size. Data collection occurs in the background, without waiting for scrape |
DOCKER_METRICS_VOLUME_CACHE | int | 30 | Cache time for collected volumes metrics in minutes. |
DOCKER_METRICS_IMAGE_UPDATE | boolean | true | Enable digest-based update check metric |
DOCKER_METRICS_IMAGE_INTERVAL | int | 30 | Image update check interval in minutes |
DOCKER_HOST | string | "" | Change the socket address to monitor a remote host or proxy instead of mounting a Docker socket for increased security (optional) |
- Connect the new target to the Prometheus configuration file:
scrape_configs:
  - job_name: logporter
    scrape_interval: 15s
    scrape_timeout: 2s
    static_configs:
      - targets:
        - localhost:9333
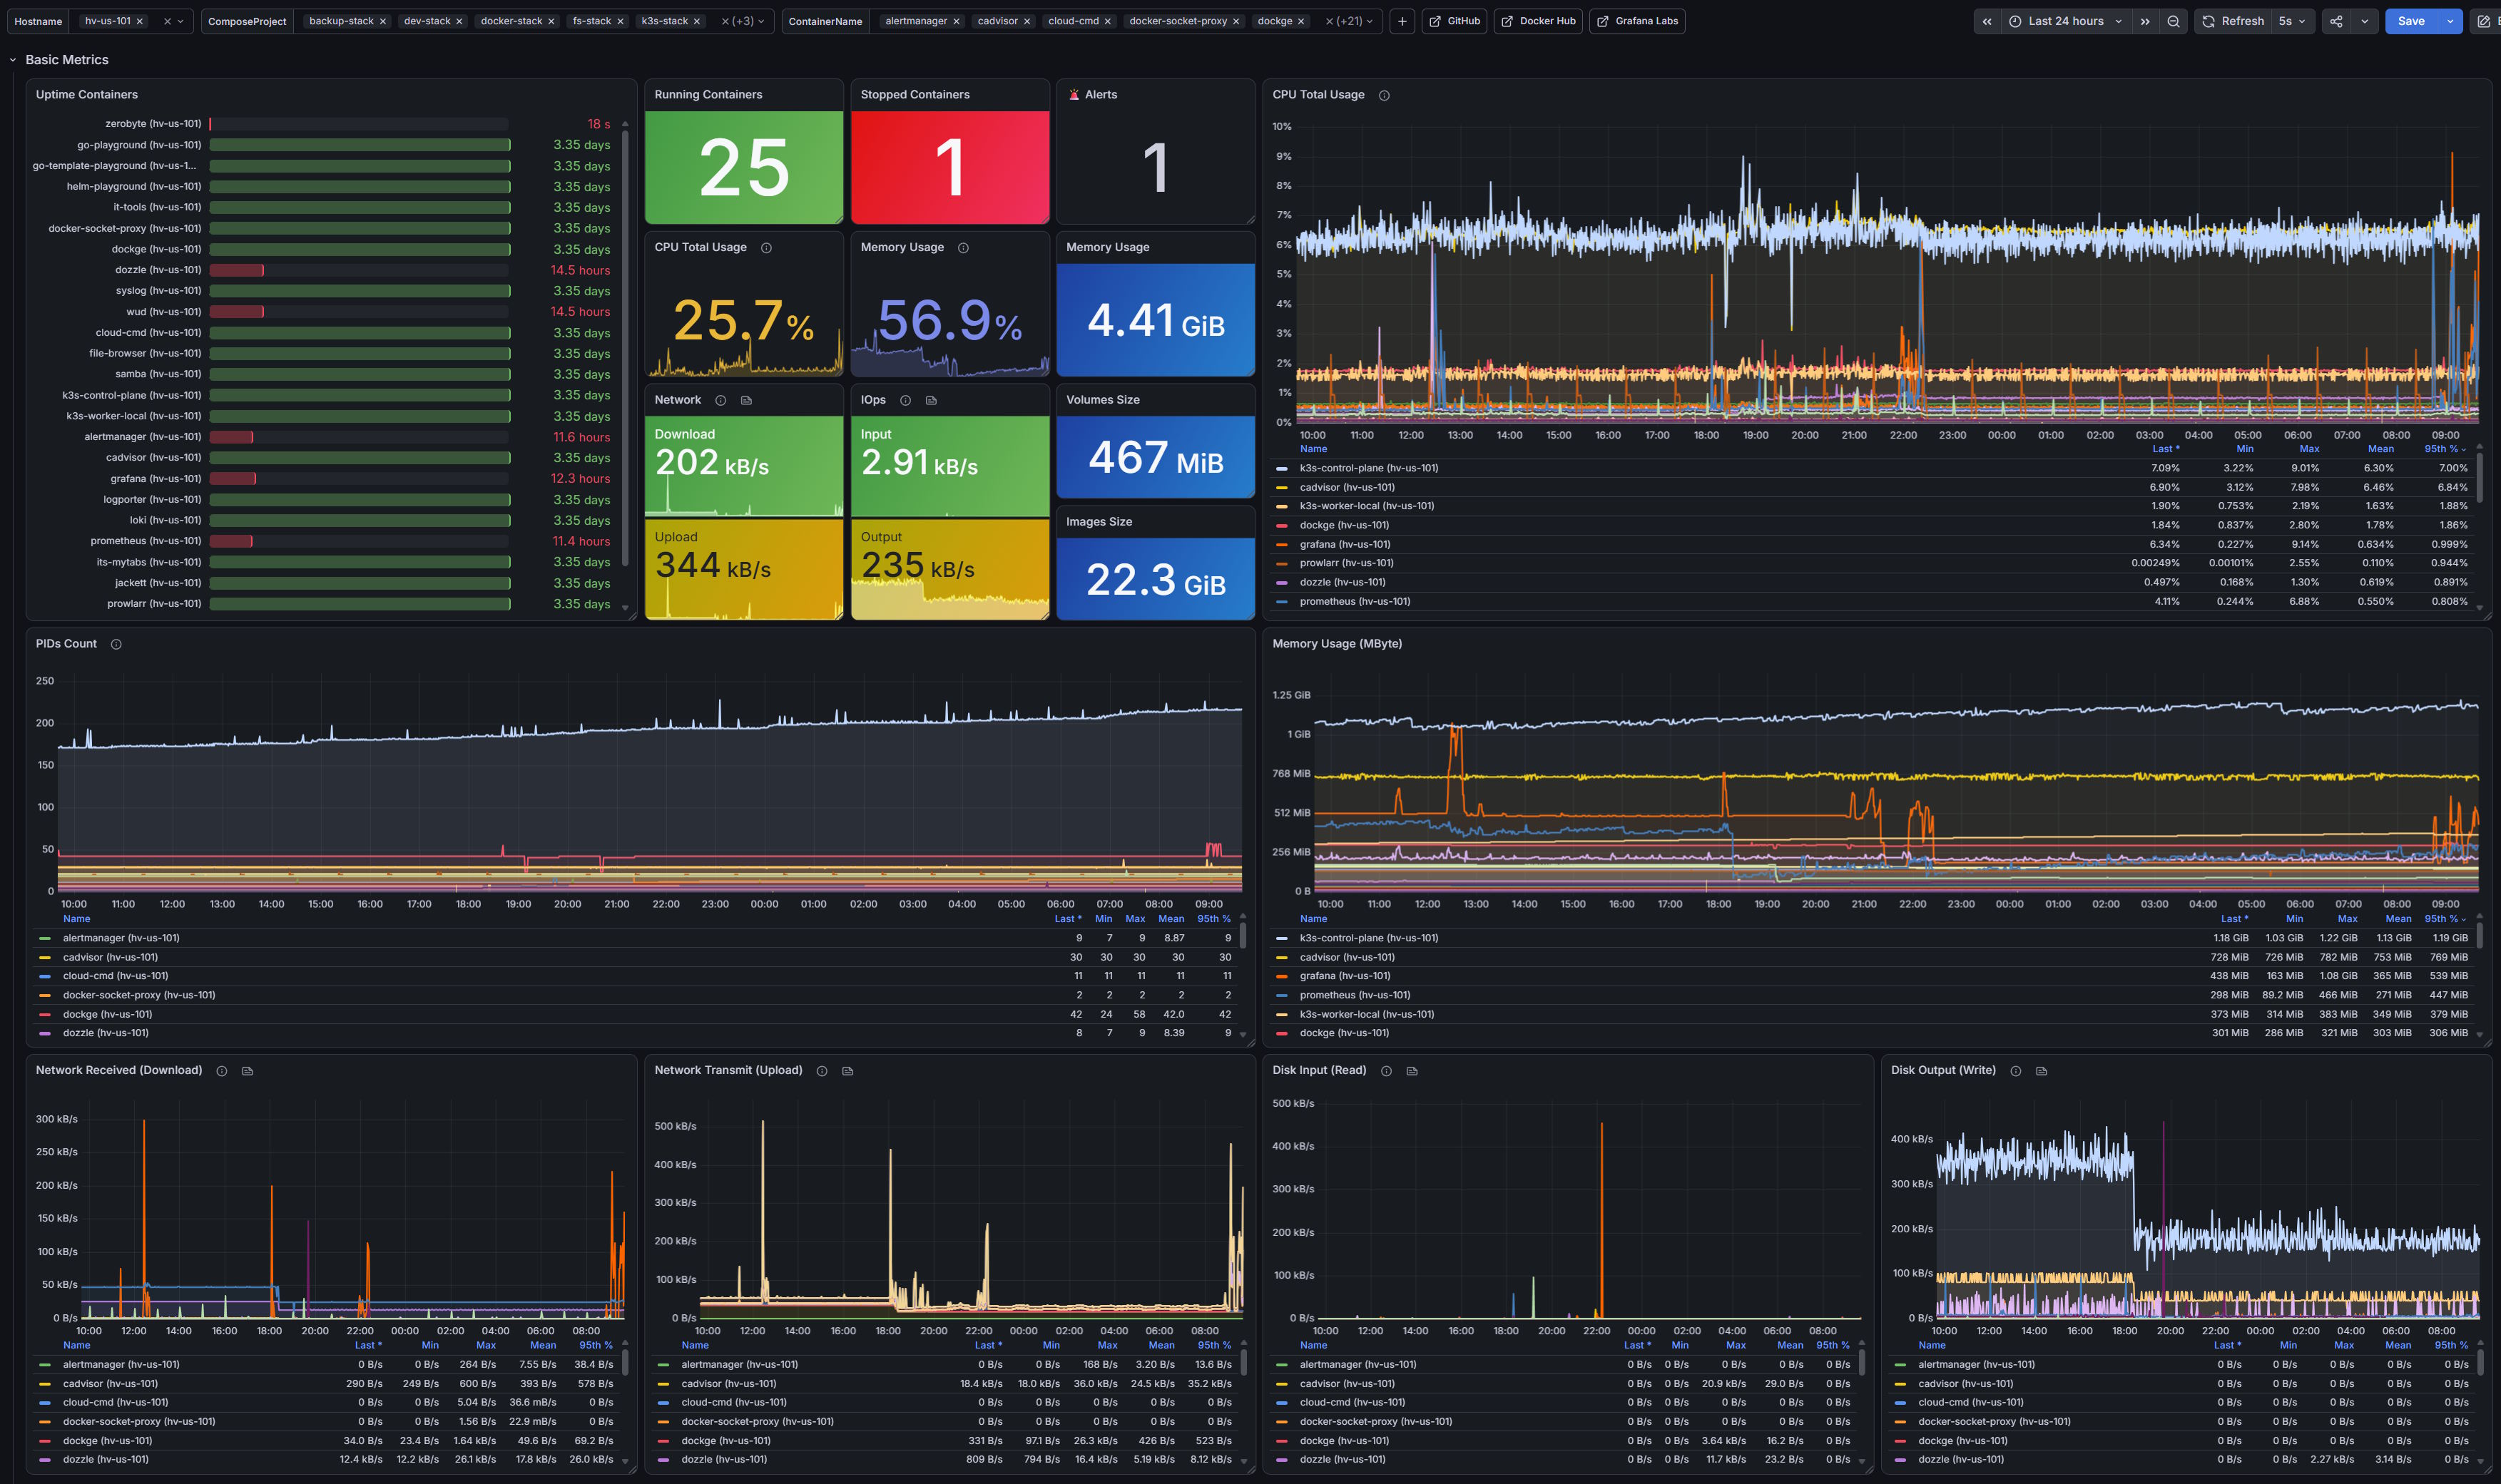
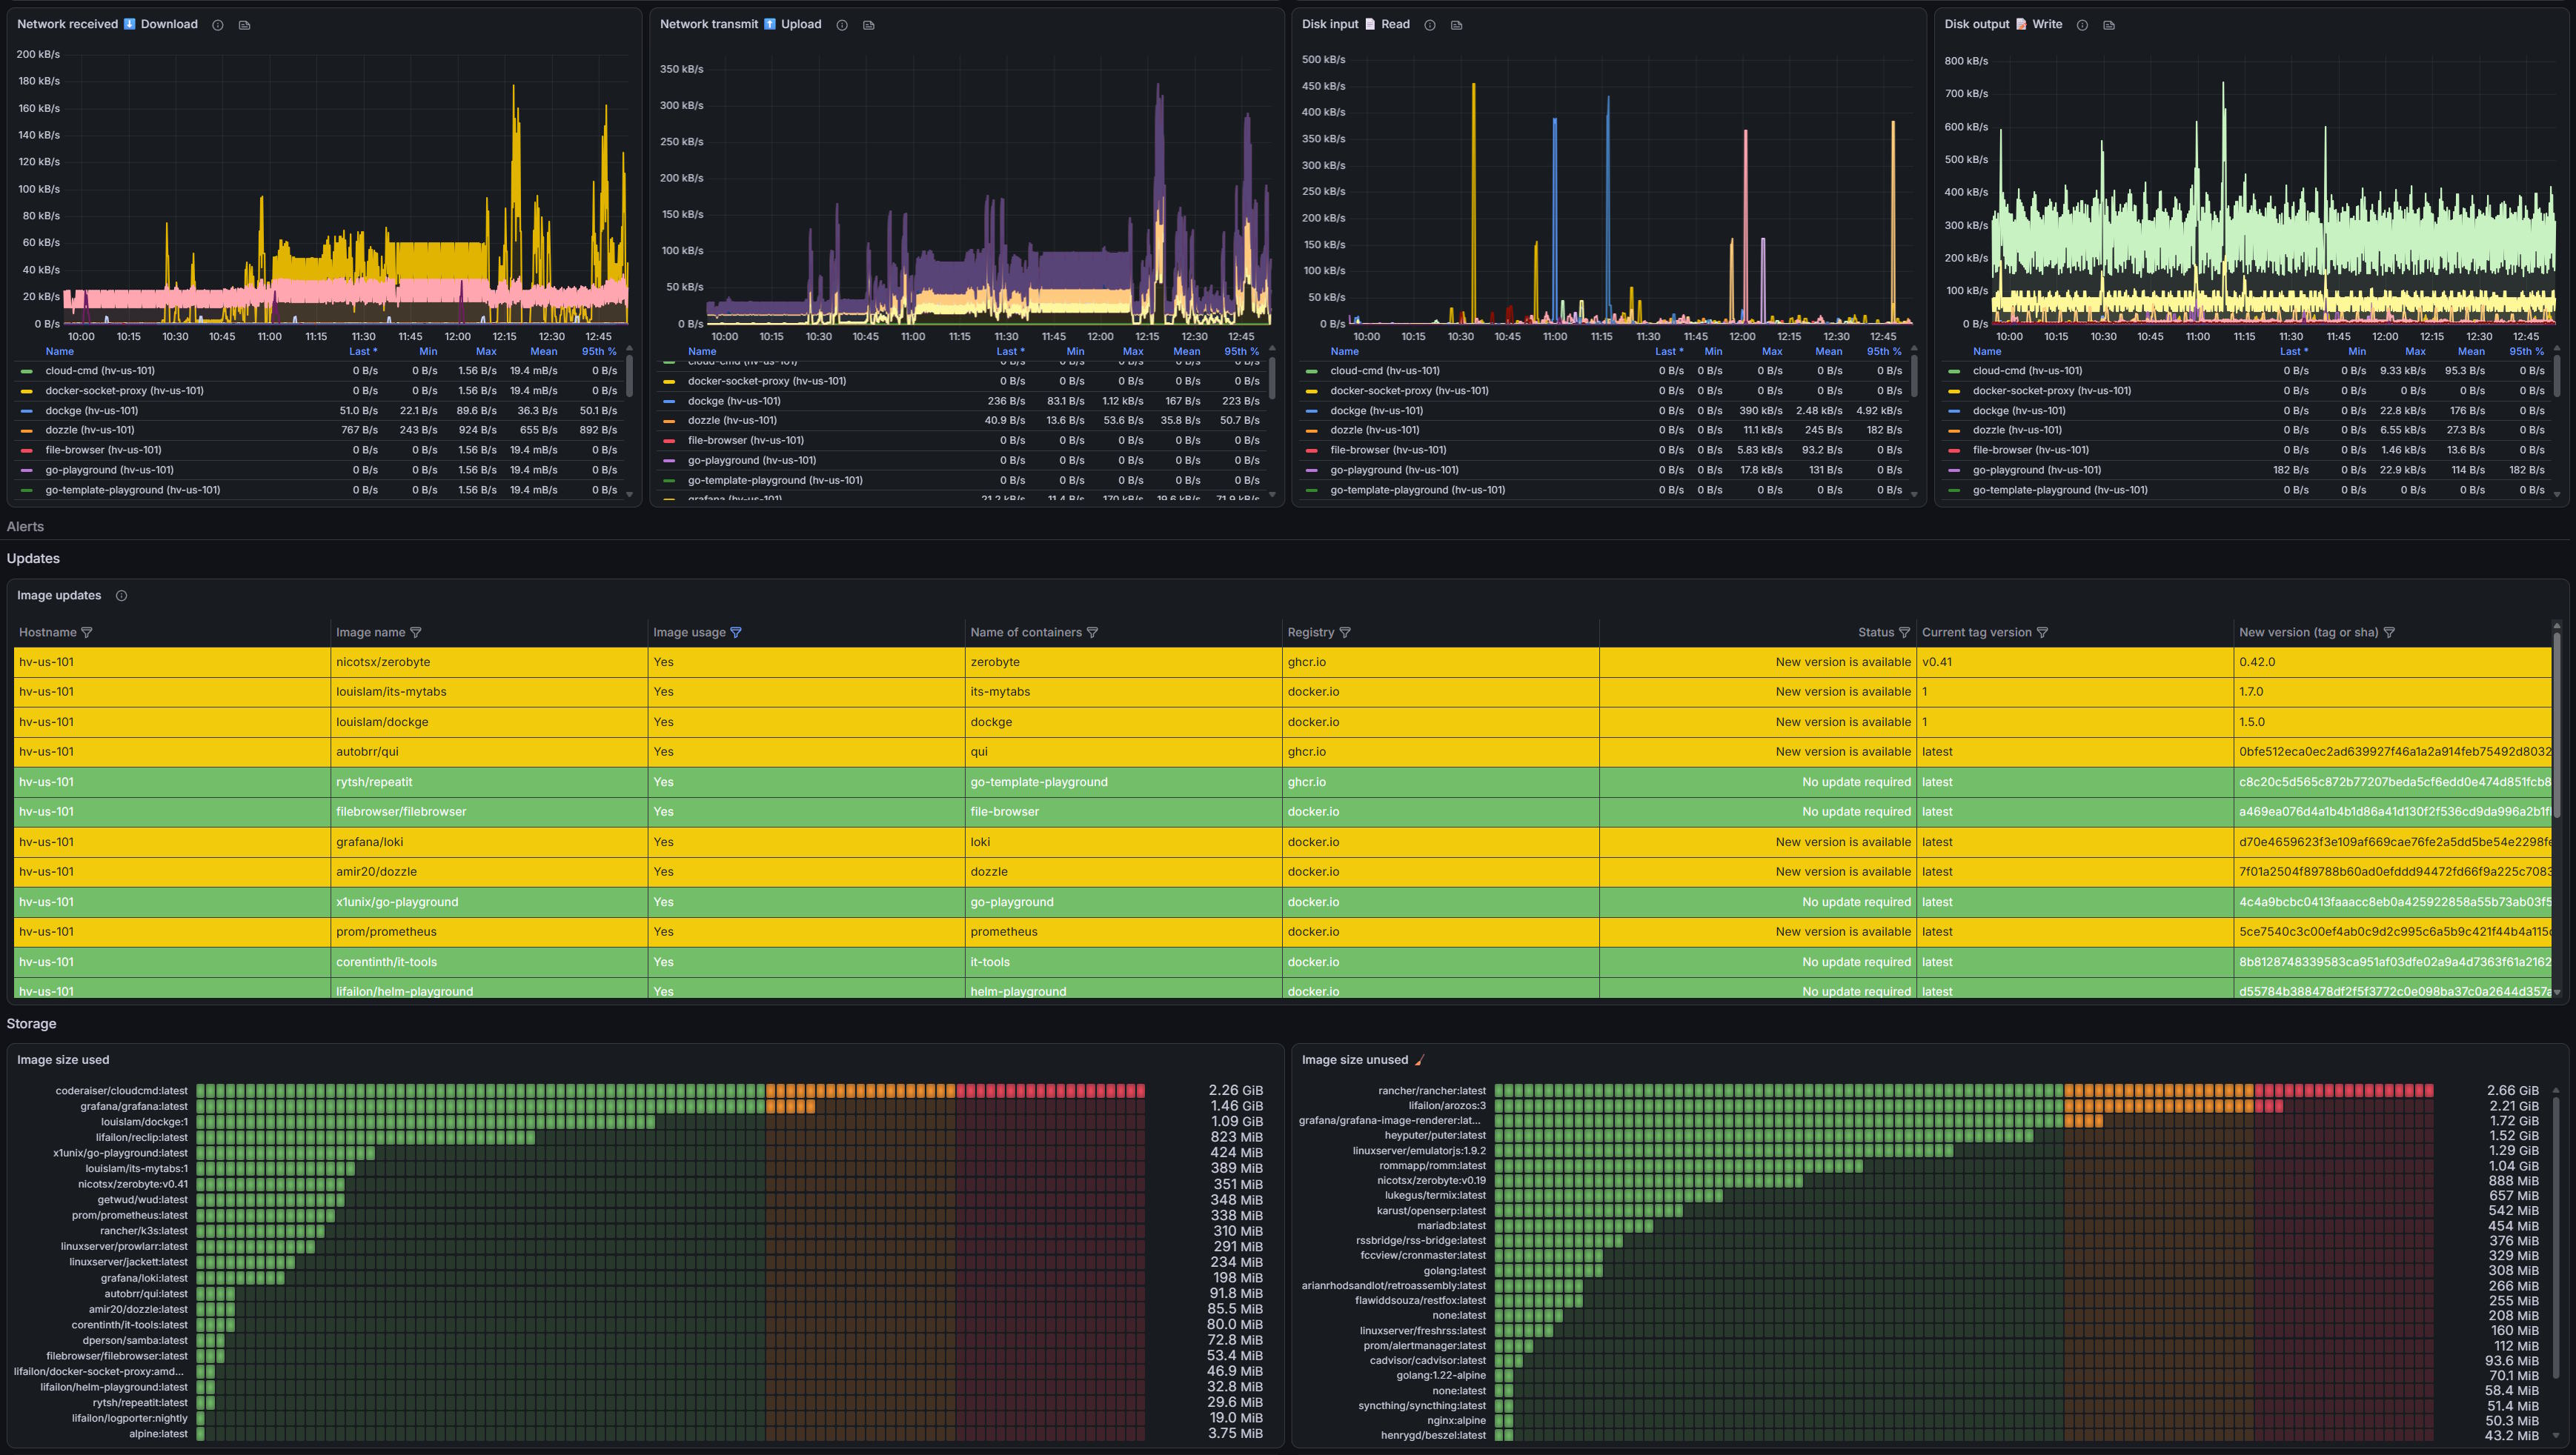
- Import the prepared public Grafana dashboard using the id
23848or from json file.
Loki
- Configure a connection with Loki to send logs using environment variables:
| Label | Type | Default | Description |
|---|---|---|---|
LOKI_URL | string | "" | Loki server address and port |
LOKI_USERNAME | string | "" | basic auth username for Loki (optional) |
LOKI_PASSWORD | string | "" | basic auth password for Loki (optional) |
LOKI_TENANT_ID | string | "" | Tenant id sent in the X-Scope-OrgID header (optional) |
LOKI_PUSH_SECONDS | int | 5 | Maximum wait time in seconds before pushing the batch to Loki |
LOKI_PUSH_LINES | int | 1000 | Maximum number of log entries (lines) before pushing the batch in one request |
LOKI_BUFFER_LINES | int | 10000 | Buffer size in entries before they are dropped (memory protection) |
By default, metrics collection is disabled if the LOKI_URL variable is empty.
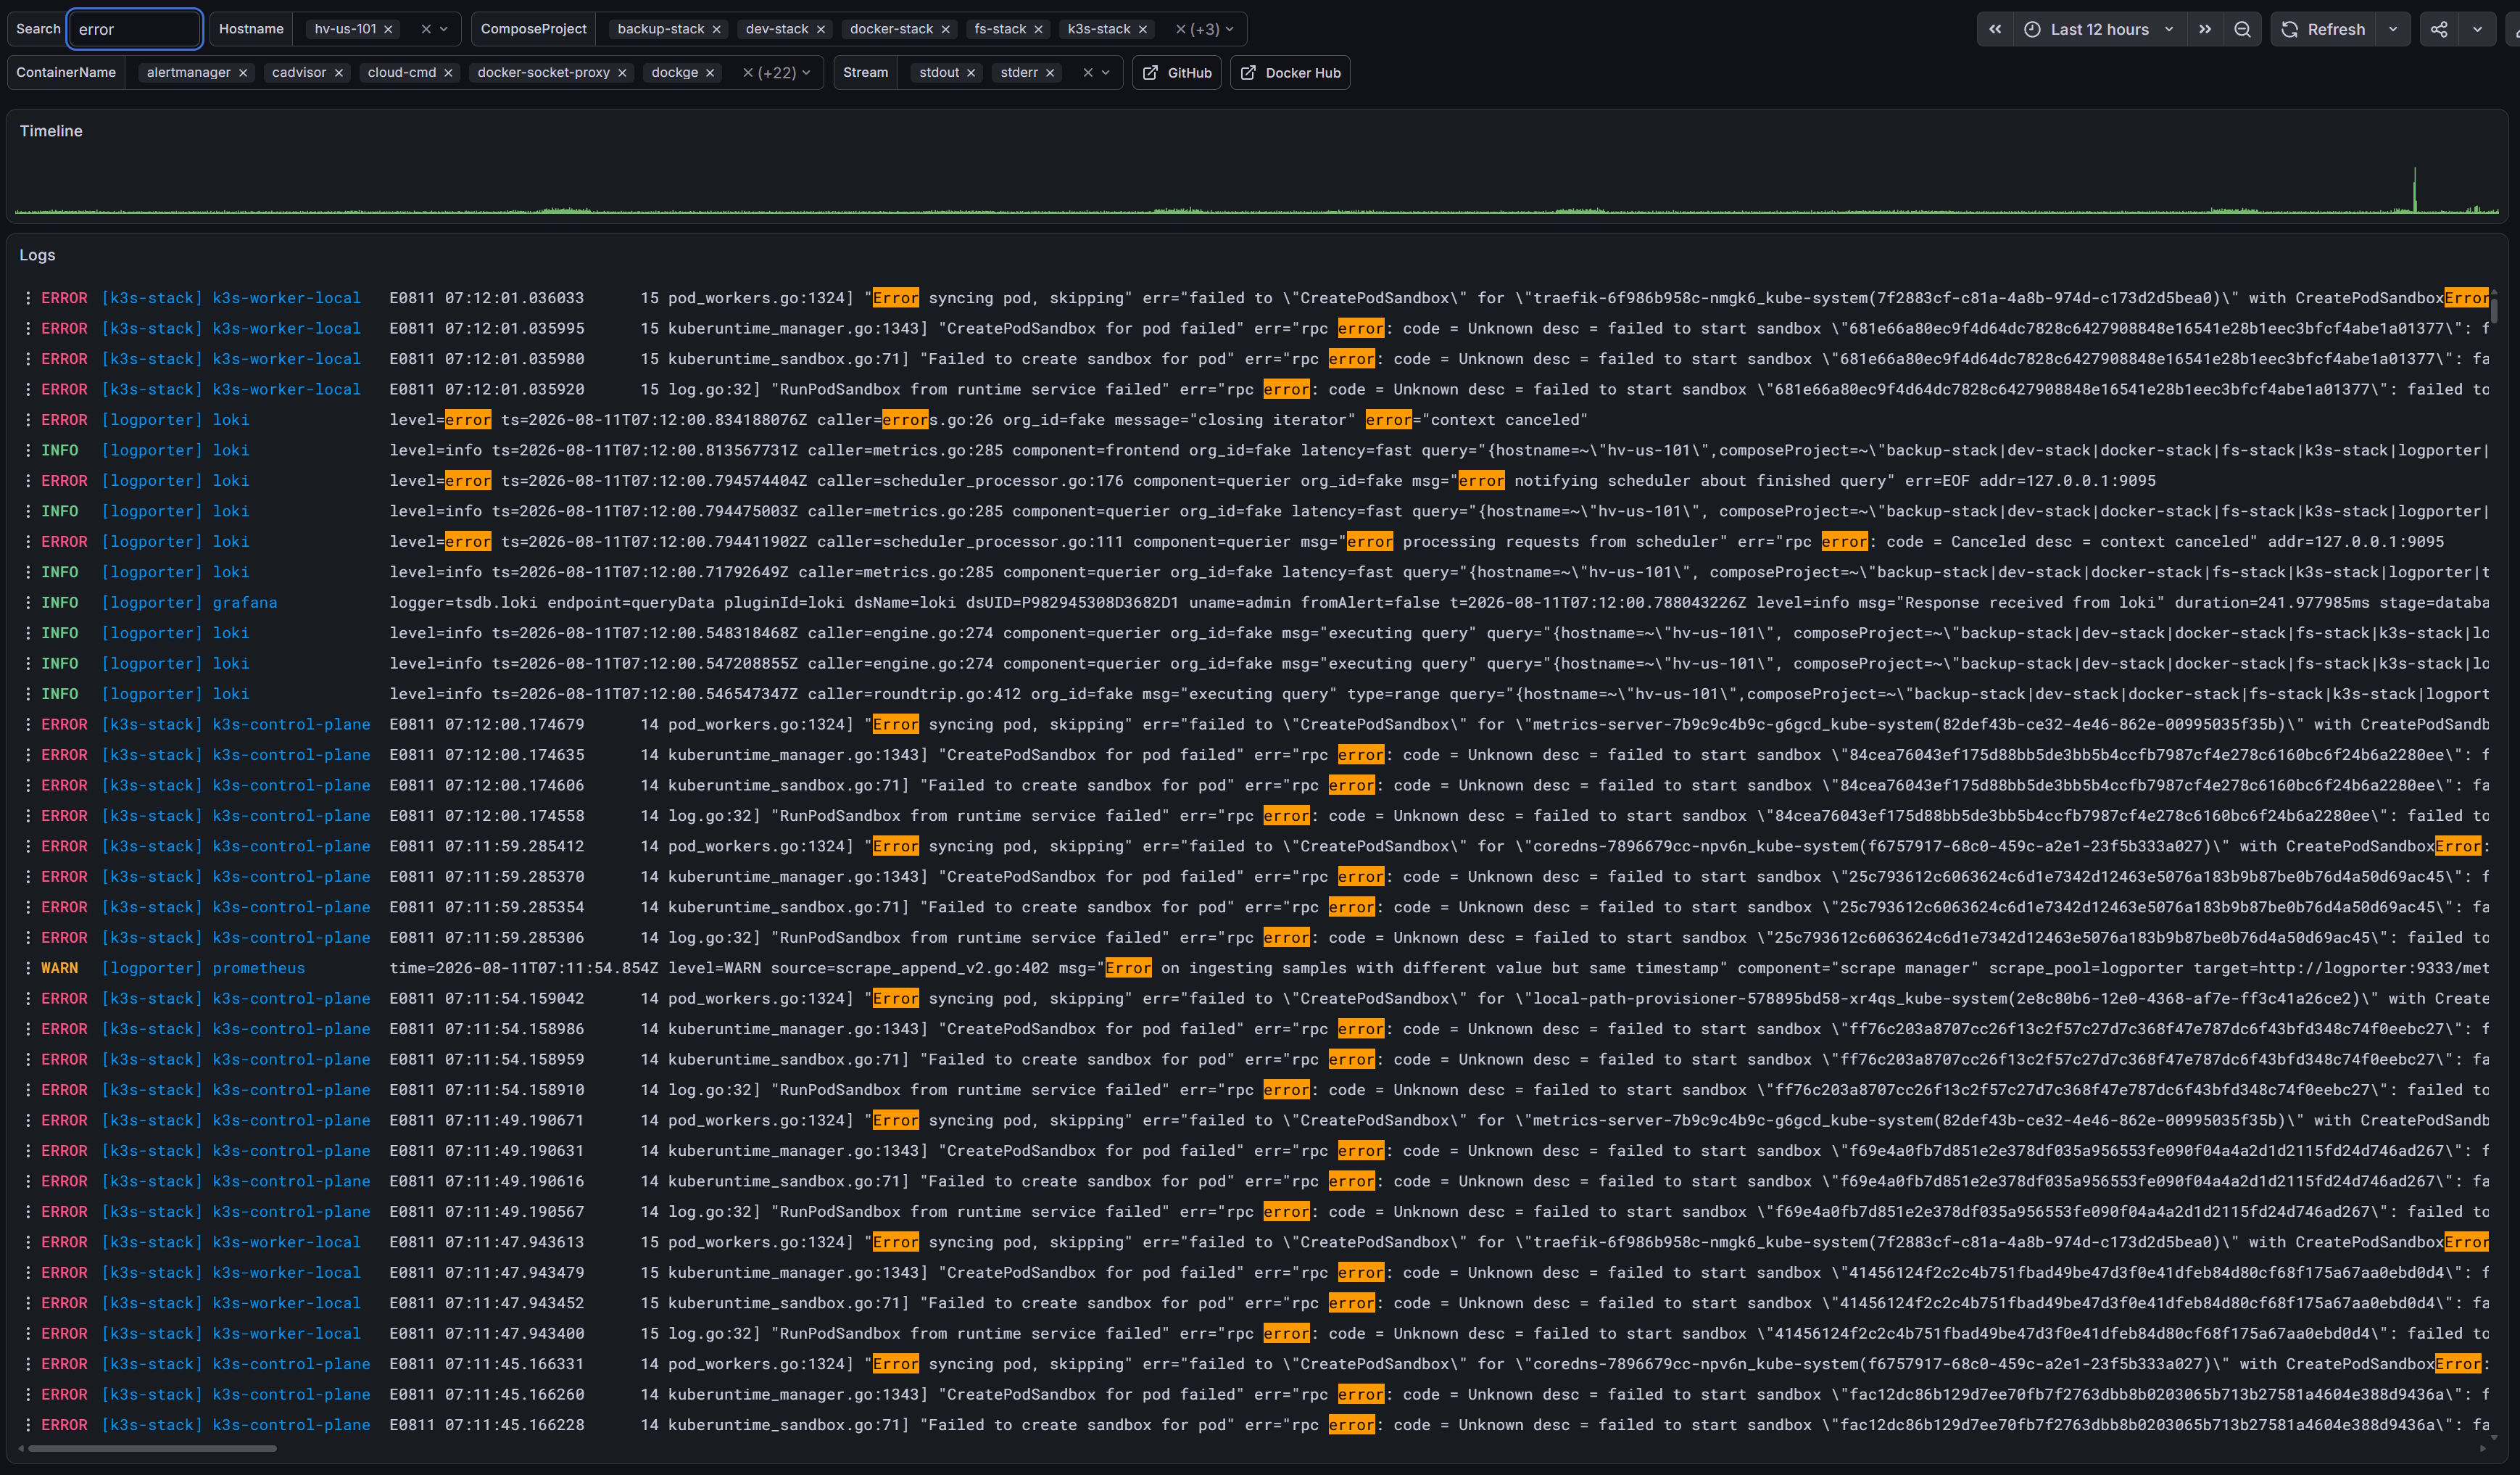
- Import the prepared Loki log dashboard into Grafana from json file.
Tag summary
Content type
Image
Digest
sha256:522a4f917…
Size
8.3 MB
Last updated
3 days ago
docker pull lifailon/logporter