lukasmartinelli/osm-noise-pollution
Approximate global noise pollution with OSM data and very simple noise model
50K+
lukasmartinelli/osm-noise-pollution repository overview
osm-noise-pollution 

:warning: This repository is no longer actively maintained by Lukas Martinelli.
Checkout the global noise pollution map online
Approximate global noise pollution with OSM data and very simple noise model. Using global street, landuse and building data from OpenStreetMap we can approximate where noise pollution might happen. We use a very simple noise model inspired by noise pollution concept of Cities Skylines.
- Inspired Urban Noise Mapping by Urbica.
- Radio interview about noise in Zurich
- Maps Mania article
- Introduction into the global noise pollution map
- Conference poster
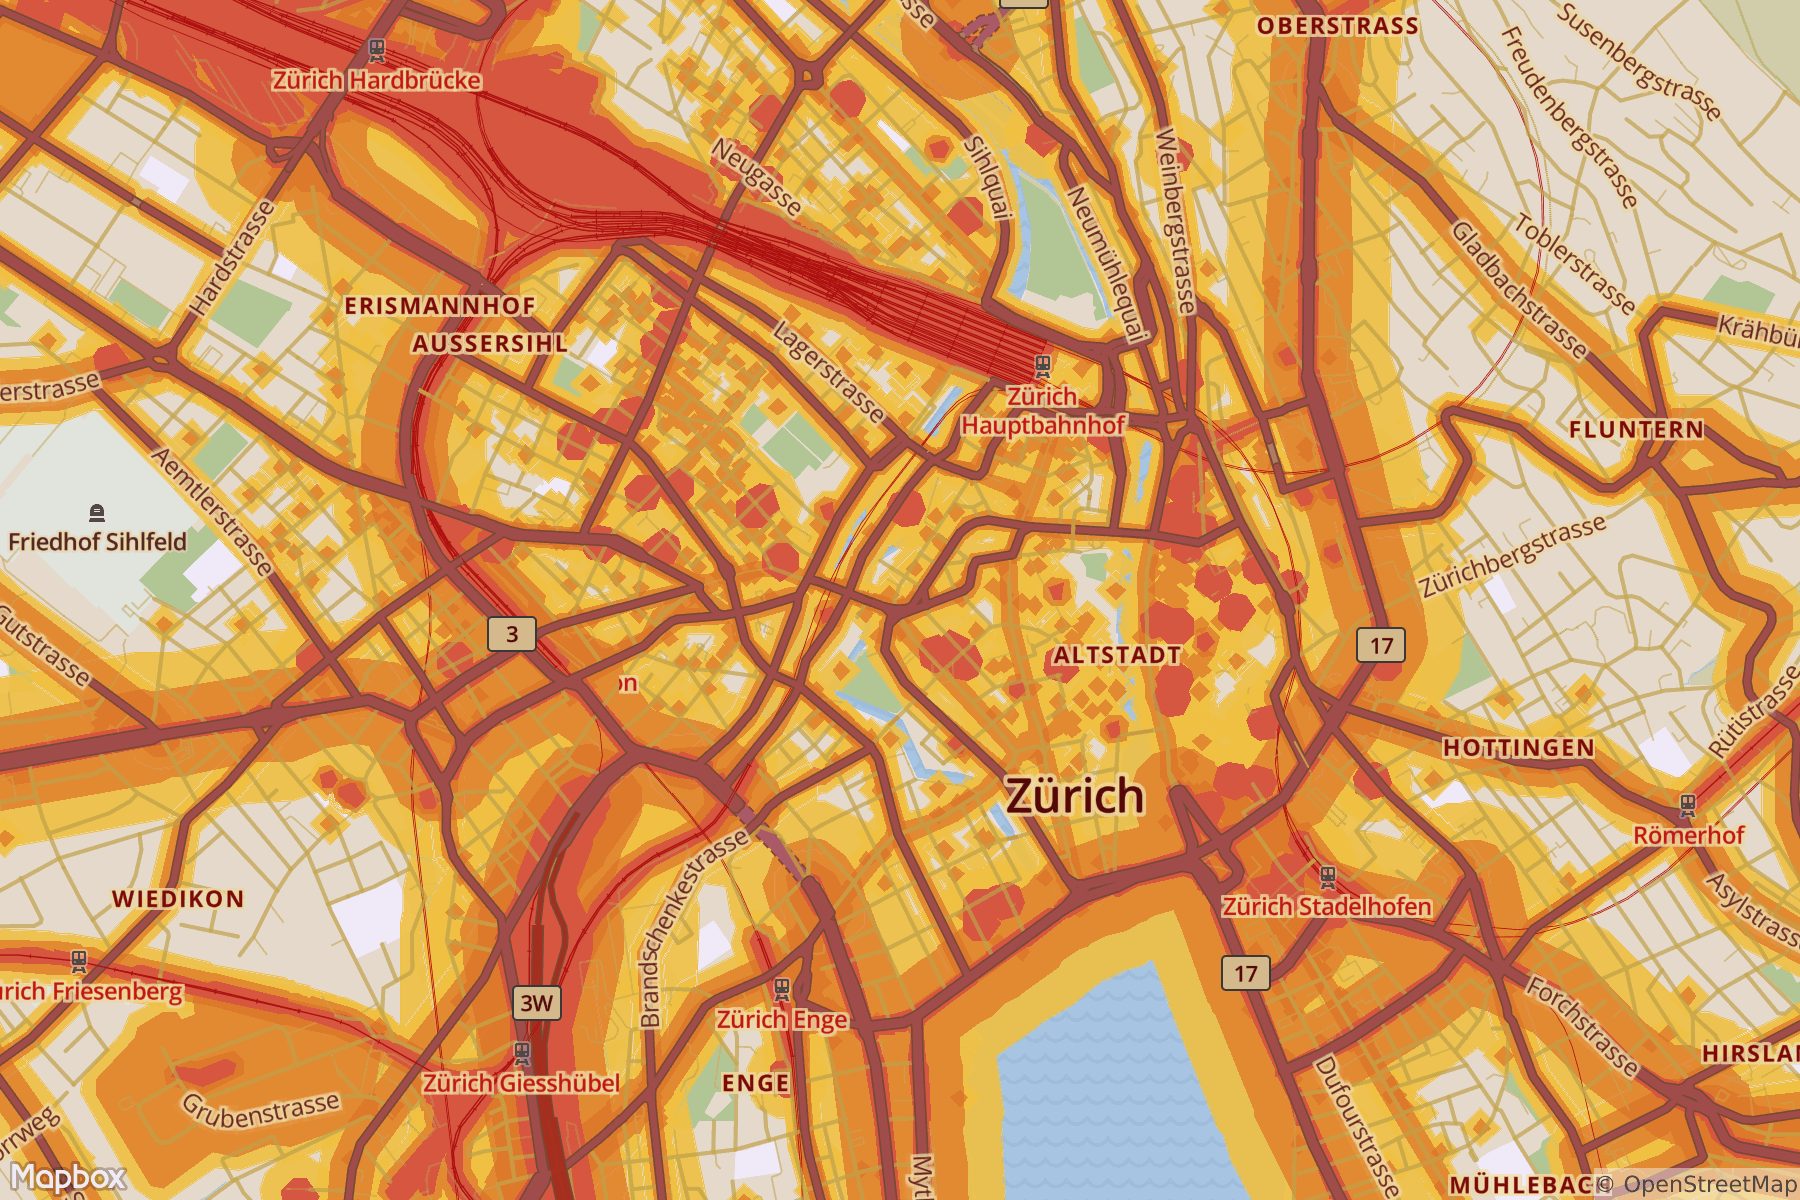
In the model we add a buffer to noisy objects. This is the area that is probably affected by noise. Very noisy objects get a high buffer and less noisy objects a smaller buffer.
In order for this to work we make several assumptions:
- Highways, trunks, primary and secondary roads are noisy. Normal street or service roads are not
- Railways are noisy
- Retail and industrial zones always have a noisy base limit
- All shops and food places (especially restaurants) are noisy
- Most party and event buildings are noisy (except some shady places)
- Most leisure buildings are noisy
- Some sport buildings are noisy
- Some tourism buildings are noisy
For OSM features that match this criterias we assign a buffer and remove the overlapping parts which results in a simple approximation of noise pollution.
Noise Levels
The noise pollution areas are divided into three noise level.
| Zone | dB |
|---|---|
| L1 | ≥ 65 |
| L2 | 55 - 64.9 |
| L3 | 45 - 54.9 |
Each OSM feature emits a custom buffer for each noise level. You are very welcome to suggest different values, they are only educated guesses derived from the Swiss sonBASE noise map. Of course this approximation does not include damping through buildings, traffic volume and all the other fancy stuff - but it is simple enough to be applied globally.
Roads
| Tag | L1 | L2 | L3 |
|---|---|---|---|
highway=motorway | 60m | 220m | 500m |
highway=trunk | 50m | 190m | 400m |
highway=primary | 35m | 160m | 300m |
highway=secondary | 80m | 125m | |
highway=tertiary | 35m | 65m |
Railways
| Tag | L1 | L2 | L3 |
|---|---|---|---|
rail=[rail,narrow_gauge,..] | 30m | 60m | 100m |
rail=[light_rail,tram,..] | 30m | 60m |
Industrial and Retail Zones
| Tag | L1 | L2 | L3 |
|---|---|---|---|
landuse=industrial | 50m | 100m | |
landuse=retail | 70m | 180m |
Shops and Food
| Tag | L1 | L2 | L3 |
|---|---|---|---|
shop=[any] | 30m | 65m | |
amenity=[bar,bbq,cafe,..] | 35m | 75m |
Party
| Tag | L1 | L2 | L3 |
|---|---|---|---|
amenity=[cinema,casino,nightclub,..] | 40m | 70m | 150m |
Leisure
| Tag | L1 | L2 | L3 |
|---|---|---|---|
leisure=[beach_resort,zoo,..] | 35m | 55m | 75m |
Sport
| Tag | L1 | L2 | L3 |
|---|---|---|---|
sporty=[baseball,soccer,..] | 40m | 60m | 80m |
These values are implemented in the vector tile data source in src/vector-datasource/data.yml.
Develop
We use the Docker Compose based workflow we developed at osm2vectortiles to create an ETL workflow to get data in and out of PostGIS. The Mapbox GL stylesheet used for the map can be found in src/mapbox-gl/style.json.
Get Started
You need a complete OSM PBF data dump either from a country extract or of the entire world.
In this example we will work with my beloved Switzerland. Download the data and put it into the data directory.
You can use Docker compose directly with the prebuilt images. If you want to develop on osm-noise-pollution you can build
the images yourself running make.
wget --directory-prefix=./data http://download.geofabrik.de/europe/switzerland-latest.osm.pbf
Now we need to set up the database and import the data using the import-osm Docker container.
# This will automatically initialize the database
docker-compose up -d postgres

# Import the OSM data dump from the ./data folder
docker-compose run import-osm
We can now export vector tiles containing the noise pollution geometries ready to
use for map visualizations with Mapnik or Mapbox GL.
If you want to change the export bounding box from Switzerland to a different
country you need to modify the BBOX env var in docker-compose.yml
for the export-vectortiles container.
docker-compose run export-vectortiles
And now we have all the data and code in place.
Let's look at it visually. Start Mapbox Studio and visit the port 3000 on your
Docker host.
docker-compose up mapbox-studio
Login and open the source project via Browse mounted at /projects. You should see vector-datasource.tm2source.
Open this project and navigate to the location of your extract to check the noise pollution visualized
in the vector data editor.
Components
The different components that attach to the postgres container are all located in the src directory.
| Component | Description |
|---|---|
| postgres | PostGIS data store for OSM data and to perform noise analysis |
| import-osm | Imposm3 based import tool with custom mapping to import selective OSM into the database and reconstruct it as GIS geometries |
| vector-datasource | Mapbox Studio Source project to generate vector tiles from the noise pollution geometries. |
| export-vectortiles | Produce vector tiles for the noise pollution geometries from the vector-datasource using tilelive |
| mapbox-studio | Mapbox Studio in a Docker container with the mounted vector-datasource to interactively work with the vector tile project. |
Tag summary
Content type
Image
Digest
Size
315.2 MB
Last updated
almost 9 years ago
docker pull lukasmartinelli/osm-noise-pollution:export-vectortiles