mellanox/ufm-plugin-tfs
UFM Telemetry stream to Fluentd Plugin
2.9K
mellanox/ufm-plugin-tfs repository overview
UFM Telemetry endpoint stream To Fluentd endpoint (TFS)
TFS UFM plugin is designed to extract the UFM Telemetry counters from the configured telemetry HTTP endpoint(s) and stream them to the configured Fluent collector destination.
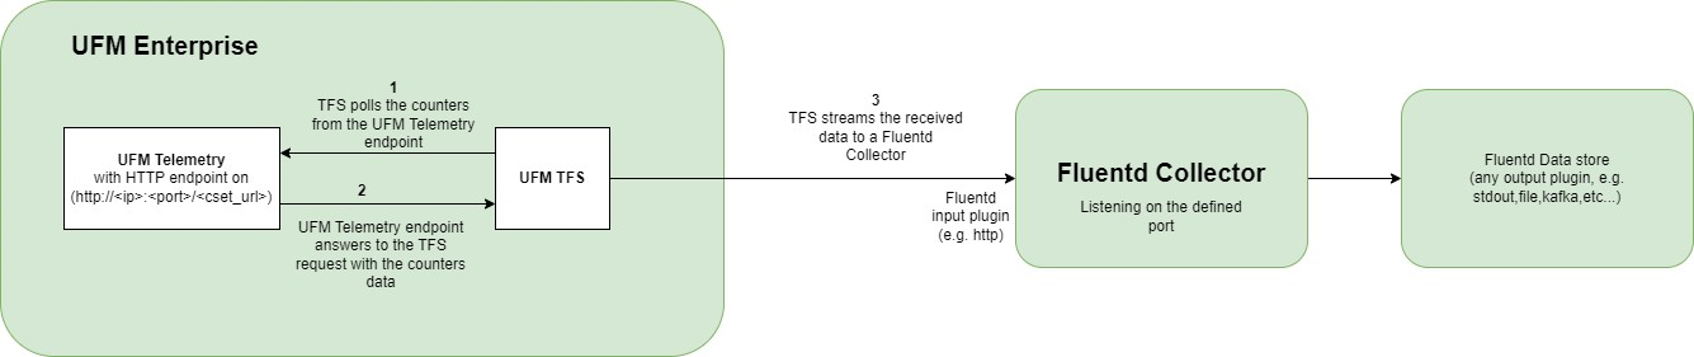
Overview
NVIDIA UFM Telemetry platform provides network validation tools to monitor network performance and conditions, capturing and streaming rich real-time network telemetry information, and application workload usage to an on-premise or cloud-based database for further analysis. As a fabric manager, the UFM Telemetry holds real-time network telemetry information of the network topology. This information should be reflected, over time (as it can change with time) towards the telemetry console. To do so, we present stream the UFM Telemetry data to the Fluentd plugin
Release Notes
-
Latest Release (1.1.0-0):
- Remove support fetching telemetry data in Prometheus format.
- Introduced a new
telemetry_request_timeoutoption, with a default value of60 seconds.
-
1.0.15-1:
- Added support for XDR technology.
- Introduced a new
enable_cached_stream_on_telemetry_failoption (default:true): This option allows streaming cached data from the last successful iteration when the telemetry endpoint is unavailable. The goal is to enhance user experience during telemetry endpoint downtimes. - Fixed various bugs.
-
1.0.0-14:
- Change the default fluent streaming protocol from HTTP to FORWARD.
- Integrated the c-forward streamer library.
- Improved performance on CSV processing.
- Fixed various bugs.
Deployment
Deploy the plugin on UFM-SDN Appliance
-
Login as admin
-
Run
enableconfig terminal -
Make sure that UFM is running
show ufm status-
If UFM is down then run it
ufm start
-
-
Make sure docker is running
no docker shutdown -
Load the latest plugin's docker image
- In case of HA, load the plugin on the standby node as well.
- If your appliance is connected to the internet, you could simply run:
docker pull mellanox/ufm-plugin-tfs - If your appliance is not connected to the internet, you need to load the image offline
- Use a machine that is connected to the internet to save the docker image
docker save mellanox/ufm-plugin-tfs:latest | gzip > ufm-plugin-tfs.tar.gz - Move the file to scp shared location that is accessible to the appliance.
- Fetch the image to the appliance
image fetch scp://user@hostname/path-to-file/ufm-plugin-tfs.tar.gz - Load the image
docker load ufm-plugin-tfs.tar.gz
- Use a machine that is connected to the internet to save the docker image
-
Enable & start the plugin
ufm plugin tfs add -
Check that the plugin is up and running with
show ufm plugin
Deploy the plugin with UFM Enterprise [Bare-metal/Docker]
-
Load the latest plugin container
-
In case of HA, load the plugin on the standby node as well;
-
If your machine is connected to the internet, you could simply run:
docker pull mellanox/ufm-plugin-tfs- If your UFM machine is not connected to the internet, you need to load the image offline
-
Use a machine that is connected to the internet to save the docker image
docker save mellanox/ufm-plugin-tfs:latest | gzip > ufm-plugin-tfs.tar.gz -
Move the file to some shared location that is accessible to the UFM machine
-
Load the image to UFM machine
docker load -i < /[some-shared-location]/ufm-plugin-tfs.tar.gz
-
- If your UFM machine is not connected to the internet, you need to load the image offline
-
-
Enable & start the plugin
- UFM bare-metal installation:
/opt/ufm/scripts/manage_ufm_plugins.sh add -p tfs- UFM docker installation:
docker exec ufm /opt/ufm/scripts/manage_ufm_plugins.sh add -p tfs -
Check that plugin is up and running with
- UFM bare-metal installation:
/opt/ufm/scripts/manage_ufm_plugins.sh show- UFM docker installation:
docker exec ufm /opt/ufm/scripts/manage_ufm_plugins.sh show
FluentdD Deployment configurations
-
Pull the Fluentd Docker by running:
docker pull fluent/fluentd -
Run the Fluentd docker by running:
docker run -ti --rm --network host -v /tmp/fluentd:/fluentd/etc fluentd -c /fluentd/etc/fluentd.conf -v
- We provide fluentd.conf as a fluentd configurations sample.
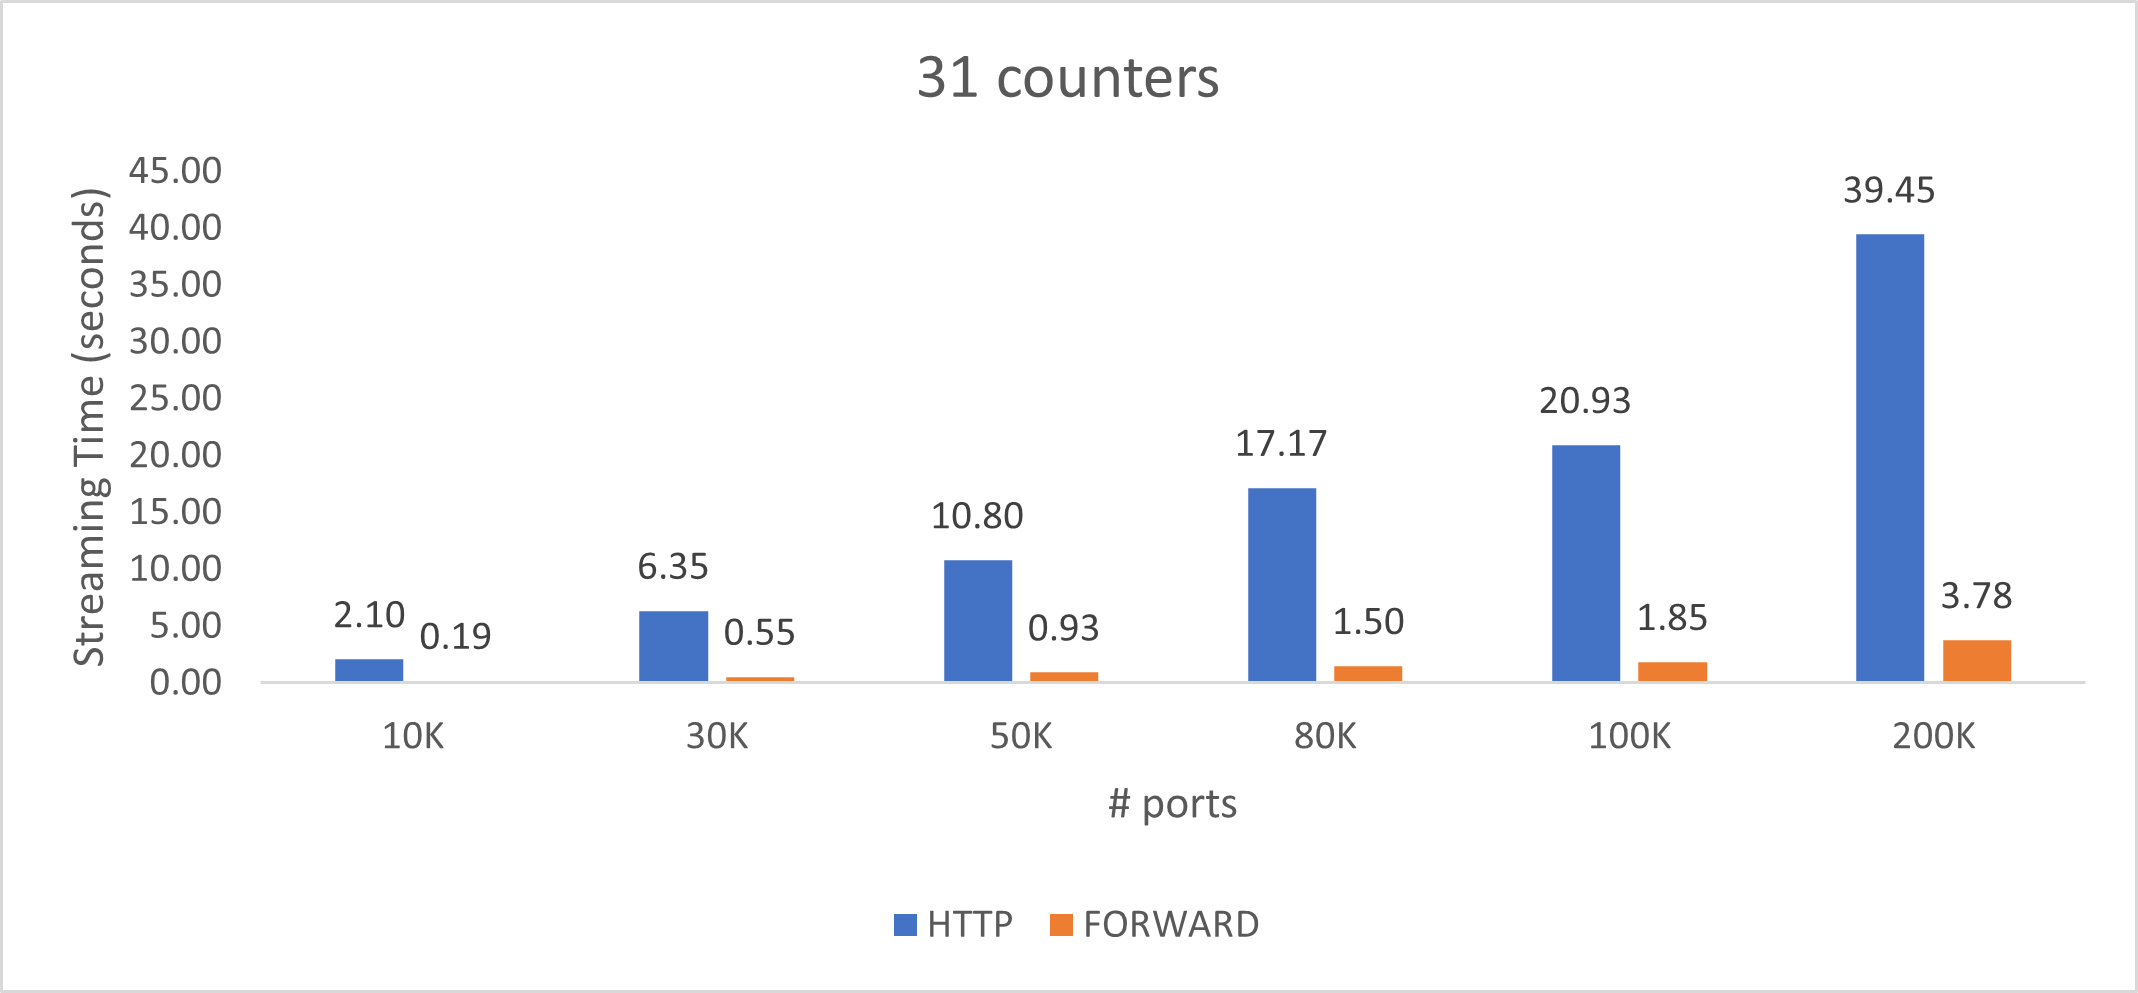
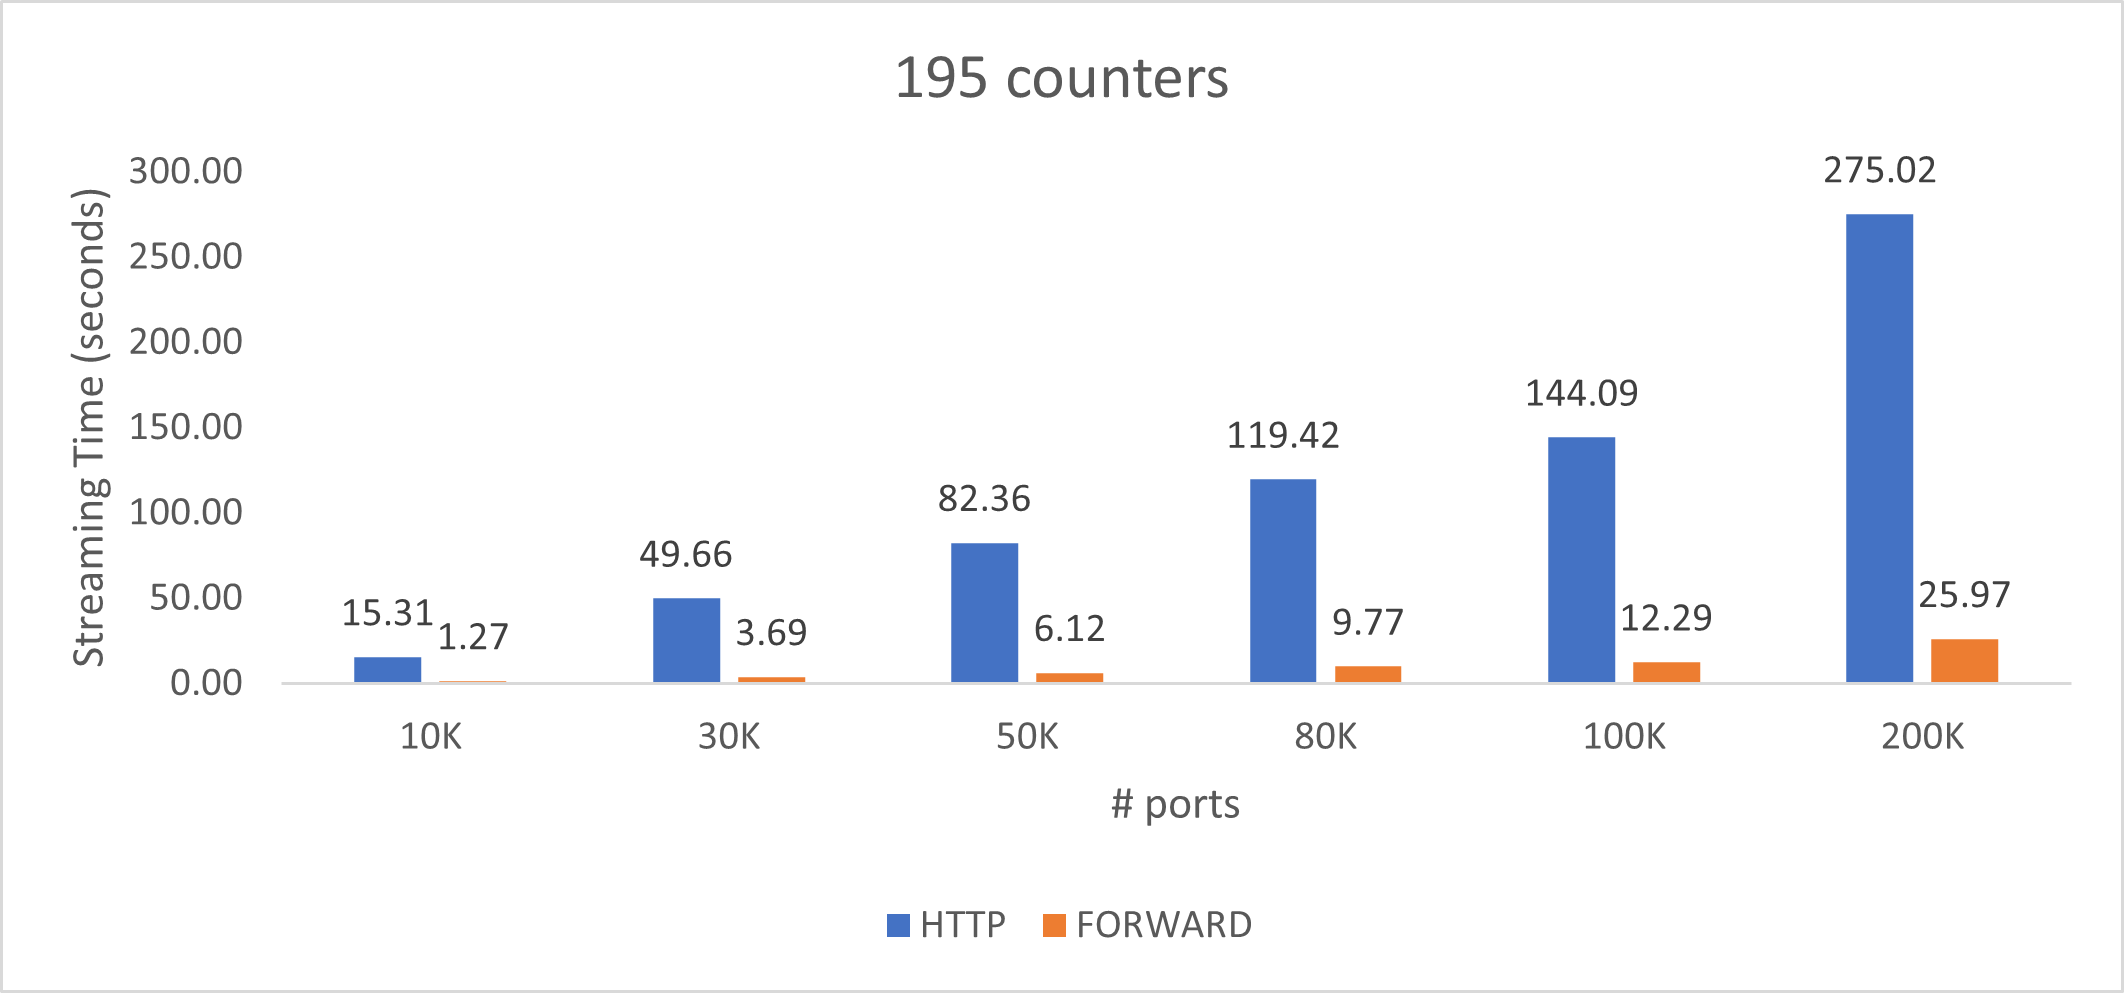
- TFS supports FORWARD and HTTP protocols for sending the data to the Fluent destination. The FORWARD is the default protocol, to switch to the HTTP protocol, need to enable streaming.compressed_streaming
IPv6 configurations
TFS supports streaming the data into the Fluent destination via the IPv6, you need to make sure that the Fluent is listening to the IPv6 interface by replacing fluentd host address (bind 0.0.0.0) with (bind ::)
The TFS logs file is located under /opt/ufm/files/log/plugins/tfs/tfs.log on the host. For UFM versions that less than 6.17.0, the logs file is located under /opt/ufm/files/log/tfs.log
Usage
TFS Configuration Parameters Details
| Parameter | Required | Description |
|---|---|---|
| fluentd-endpoint.host | True | Hostname or IPv4 or IPv6 for Fluentd endpoint |
| fluentd-endpoint.port | True | Port for Fluentd endpoint [this port should be the port which is configured in fluentd.conf] |
| fluentd-endpoint.timeout | True | Timeout for Fluentd endpoint streaming [Default is 120 seconds] |
| ufm-telemetry-endpoint.host | True | Hostname or IPv4 or IPv6 for The UFM Telemetry Endpoint [Default is 127.0.0.1] |
| ufm-telemetry-endpoint.port | True | Port for The UFM Telemetry Endpoint [Default is 9001] |
| ufm-telemetry-endpoint.url | True | URL for The UFM Telemetry Endpoint [Default is 'csv/metrics', for Prometheus format you can use 'metrics'] |
| ufm-telemetry-endpoint.interval | True | Streaming interval [Default is 10 seconds] |
| ufm-telemetry-endpoint.message_tag_name | False | Message Tag Name for Fluentd endpoint message[Default is the ufm-telemetry-endpoint.host:ufm-telemetry-endpoint.port] |
| streaming.bulk_streaming | True | if True all telemetry records will be streamed in one message; otherwise, each record will be streamed in a separated message [Default is True] |
| streaming.compressed_streaming | True | if True, the streamed data will be sent gzipped JSON (and you have to make sure to configure the FluentD receiver with the right configurations [Check the FluentdD Deployment configurations section]); otherwise, the message will be sent plain text as json [Default is True] |
| streaming.stream_only_new_samples | True | If True, the plugin will stream only the changed values [Default is True] |
| streaming.enabled | True | If True, the streaming will be started once the required configurations have been set [Default is False] |
| logs-config.logs_file_name | True | Log file name [Default = '/log/tfs.log'] |
| logs-config.logs_level | True | Default is 'INFO' |
| logs-config.max_log_file_size | True | Maximum log file size in Bytes [Default is 10 MB] |
| logs-config.log_file_backup_count | True | Maximum number of backup log files [Default is 5] |
Set / Update the plugin's configurations
The following REST API is provided to set the plugin's configurations:
METHOD: POST
URL: https://[HOST-IP]/ufmRest/plugin/tfs/conf
cURL Example:
curl --location 'https://<UFM_IP>/ufmRest/plugin/tfs/conf' \
--header 'Content-Type: application/json' \
--data '{
 "fluentd-endpoint": {
     "host": "<FLUENT_RECIEVER_IP>",
     "port": 24224,
     "timeout": 120
 },
 "streaming": {
     "enabled": true,
     "stream_only_new_samples": false
 },
 "ufm-telemetry-endpoint": [
     {
         "host": "127.0.0.1",
         "interval": <COLLECTING_INTERVAL_SECONDS, e.g. 30>,
         "port": <TELEMETRY_HTTP_PORT, e.g. 9001>,
         "url": <TELEMETRY_CSET_URL, e.g. csv/metrics OR csv/cset/converted_enterprise>
     }
 ]
}' -k -u <UFM_USERNAME>:<UFM_PASSWORD>
Full Payload Example:
{
     "ufm-telemetry-endpoint": [{
         "host": "127.0.0.1",
         "url": "csv/metrics",
         "port": 9001,
         "interval": 30,
         "message_tag_name": "high_freq_endpoint"
     }],
     "fluentd-endpoint": {
         "host": "10.209.36.68",
         "port": 24226
     },
     "streaming": {
         "compressed_streaming": false,
         "bulk_streaming": true,
         "enabled": true,
         "stream_only_new_samples": true
     },
     "logs-config": {
         "log_file_backup_count": 5,
         "log_file_max_size": 10485760,
         "logs_file_name": "/log/tfs.log",
         "logs_level": "INFO"
     },
     "meta-fields":{
         "alias_node_description": "node_name",
         "alias_node_guid": "AID",
         "add_type":"csv"
     }
 }
Get the plugin configurations
The following REST API is provided to get the current plugin's configurations:
METHOD: GET
URL: https://[HOST-IP]/ufmRest/plugin/tfs/conf
cURL Example:
curl --location 'https://<UFM_IP>/ufmRest/plugin/tfs/conf' -k -u <UFM_USERNAME>:<UFM_PASSWORD>
Response Example:
{
     "ufm-telemetry-endpoint": [{
         "host": "127.0.0.1",
         "url": "csv/metrics",
         "port": 9001,
         "interval": 30,
         "message_tag_name": "high_freq_endpoint"
     }],
     "fluentd-endpoint": {
         "host": "10.209.36.68",
         "port": 24226
     },
     "streaming": {
         "compressed_streaming": false,
         "bulk_streaming": true,
         "enabled": true,
         "stream_only_new_samples": true
     },
     "logs-config": {
         "log_file_backup_count": 5,
         "log_file_max_size": 10485760,
         "logs_file_name": "/log/tfs.log",
         "logs_level": "INFO"
     },
     "meta-fields":{
         "alias_node_description": "node_name",
         "alias_node_guid": "AID",
         "add_type":"csv"
     }
 }
Streaming data from multiple UFM Telemetry endpoints
You can configure the TFS plugin to poll metrics from multiple endpoints. To do this, add the telemetry endpoint configurations using the conf API. Each added endpoint will have its own polling/streaming interval.
Payload example with multiple UFM Telemetry endpoints:
{
     "ufm-telemetry-endpoint": [{
         "host": "127.0.0.1",
         "url": "csv/metrics",
         "port": 9001,
         "interval": 10,
         "message_tag_name": "high_freq_endpoint"
     },{
         "host": "127.0.0.1",
         "url": "csv/metrics",
         "port": 9002,
         "interval": 60,
         "message_tag_name": "low_freq_endpoint"
     }],
     "fluentd-endpoint": {
         "host": "10.209.36.68",
         "port": 24226
     }
 }
Sharding in UFM Telemetry
The sharding functionality that is built into UFM telemetry, allows for efficient data polling from multiple telemetry metrics endpoints. This feature is particularly useful when dealing with large amounts of data or when operating in a network with limited bandwidth.
How To Utilize Sharding in TFS:
To use the sharding functionality, you need to add specific parameters to the URL of the configured telemetry endpoint. These parameters include num_shards, shard, and sharding_field.
Here is a payload example of how to use these parameters with the TFS configurations payload:
{
     "ufm-telemetry-endpoint": [{
         "host": "127.0.0.1",
         "url": "csv/xcset/ib_basic_debug?num_shards=3&shard=0&sharding_field=port_guid",
         "port": 9002,
         "interval": 120
     },{
         "host": "127.0.0.1",
         "url": "csv/xcset/ib_basic_debug?num_shards=3&shard=1&sharding_field=port_guid",
         "port": 9002,
         "interval": 120
     },{
         "host": "127.0.0.1",
         "url": "csv/xcset/ib_basic_debug?num_shards=3&shard=2&sharding_field=port_guid",
         "port": 9002,
         "interval": 120
     }],
     "fluentd-endpoint": {
         "host": "10.209.36.68",
         "port": 24226
     }
 }
In this example, the telemetry data is divided into three shards (num_shards=3),
and each endpoint with a different shard (shard=0, shard=1, shard=2).
The sharding_field parameter is used to specify the field on which the data is to be sharded.
In the provided example, sharding_field is set to port_guid.
This means that the data is divided into shards based on the port_guid field.
This field was chosen because it provides a convenient way to divide the data into distinct, non-overlapping shards.
Tuning the Sharding:
For optimal performance, it is recommended to tune the sharding so that a single shard transfers in about 10-15 seconds. This leaves plenty of overhead to avoid the telemetry's server timeout issues. You may need to experiment with the number of shards to achieve this. For instance, if your network is slow, you might need to increase the number of shards.
Adding customized meta-field records to the TFS messages
Meta-fields are custom fields that you can add to each record streamed through TFS. There are two types of meta-fields: Aliases and Constants.
Aliases Aliases allow you to rename an existing field in the record. To create an alias, specify the original field name and the new name you want to use. Note that aliases only work with fields that match the exact name specified.
-
Syntax
alias_originalFieldName=aliasName
-
Example If you want to rename the field "node_guid" to "AID", you would use:
alias_node_guid=AID
Constans Constants let you add a new field with a fixed value to each record.
-
Syntax
add_newFieldName=constantValue
-
Example To add a new field named "type" with the value "csv", you would use:
add_type=csv
Payload configurations example Here’s how you can define these meta-fields in the TFS configuration payload:
{
    "meta-fields": {
        "alias_node_description": "node_name",
        "alias_node_guid": "AID",
        "add_type": "csv"
    }
}
Expected output
{
      "timestamp": "1644411135311315",
      "source_id": "0xe41d2d030003e450",
      "node_guid": "e41d2d030003e450",
      "port_guid": "e41d2d030003e450",
      "port_num": "10",
      "node_description": "SwitchIB Mellanox Technologies",
      "node_name": "SwitchIB Mellanox Technologies",
      "AID": "e41d2d030003e450",
      "type": "csv"
}
Customizing the telemetry's attributes / counters
You can customize which counters to stream and how they named using the REST API.
-
Get the current attributes configurations by the following REST API:
METHOD: GET
URL: https://[UFM-IP]/ufmRest/plugin/tfs/conf/attributes
cURL Example:
curl --location 'https://<UFM_IP>/ufmRest/plugin/tfs/conf/attributes' -k -u <UFM_USERNAME>:<UFM_PASSWORD>Response Example:
JSON contains all the attributes and their configurations:
{ "ExcessiveBufferOverrunErrorsExtended": { "enabled": true, "name": "ExcessiveBufferOverrunErrorsExtended" }, "LinkDownedCounterExtended": { "enabled": true, "name": "LinkDownedCounterExtended" }, "LinkErrorRecoveryCounterExtended": { "enabled": true, "name": "LinkErrorRecoveryCounterExtended" }, "LocalLinkIntegrityErrorsExtended": { "enabled": true, "name": "LocalLinkIntegrityErrorsExtended" } } -
Update the streaming attributes configurations by the following REST API:
METHOD: POST
URL: https://[UFM-IP]/ufmRest/plugin/tfs/conf/attributes
cURL Example:
 curl --location 'https://<UFM_IP>/ufmRest/plugin/tfs/conf/attributes' \
 --header 'Content-Type: application/json' \
 --data '{
      "ExcessiveBufferOverrunErrorsExtended": {
         "enabled": true,
         "name": "ExcBuffOverrunErrExt"
     },
     "LinkDownedCounterExtended": {
         "enabled": false
     },
     "LinkErrorRecoveryCounterExtended": {
         "enabled": true,
         "name": "linkErrRecCountExt"
     },
     "LocalLinkIntegrityErrorsExtended": {
         "enabled": true,
         "name": "localLinkIntErrExt"
     }
 }' -k -u <UFM_USERNAME>:<UFM_PASSWORD>
| Parameter | Required | Description |
|---|---|---|
| attribute.enabled | True | If True, the attribute will be part of the streamed data |
| attribute.name | True | The name of the attribute in the streamed json data |
- Changes to attribute configurations are applied automatically and will take effect during the next streaming period.
Monitor the streaming performance & statistics
Prometheus HTTP endpoint is provided, that contains metrics about the streaming performance & statistics for the last streaming period.
-
Get the streaming performance statistics by the following API:
METHOD: GET
URL: https://[UFM-IP]/ufmRest/plugin/tfs/metrics
Response: Text contains performance metrics for the last streaming interval in Prometheus format:
# HELP num_of_processed_counters_in_last_msg Number of processed counters/attributes in the last streaming interval # TYPE num_of_processed_counters_in_last_msg gauge num_of_processed_counters_in_last_msg{endpoint="10.209.36.68:9001/csv/xcset/ib_basic_debug"} 176.0 num_of_processed_counters_in_last_msg{endpoint="10.209.36.67:9001/csv/xcset/ib_basic_debug"} 189.0 # HELP num_of_streamed_ports_in_last_msg Number of processed ports in the last streaming interval # TYPE num_of_streamed_ports_in_last_msg gauge num_of_streamed_ports_in_last_msg{endpoint="10.209.36.68:9001/csv/xcset/ib_basic_debug"} 6.0 num_of_streamed_ports_in_last_msg{endpoint="10.209.36.67:9001/csv/xcset/ib_basic_debug"} 4.0 # HELP streaming_time_seconds Time period for last streamed message in seconds # TYPE streaming_time_seconds gauge streaming_time_seconds{endpoint="10.209.36.68:9001/csv/xcset/ib_basic_debug"} 0.064626 streaming_time_seconds{endpoint="10.209.36.67:9001/csv/xcset/ib_basic_debug"} 0.025279 # HELP telemetry_expected_response_size_bytes Expected size of the last received telemetry response in bytes # TYPE telemetry_expected_response_size_bytes gauge telemetry_expected_response_size_bytes{endpoint="10.209.36.68:9001/csv/xcset/ib_basic_debug"} 5156.0 telemetry_expected_response_size_bytes{endpoint="10.209.36.67:9001/csv/xcset/ib_basic_debug"} 4726.0 # HELP telemetry_received_response_size_bytes Actual size of the last received telemetry response in bytes # TYPE telemetry_received_response_size_bytes gauge telemetry_received_response_size_bytes{endpoint="10.209.36.68:9001/csv/xcset/ib_basic_debug"} 5156.0 telemetry_received_response_size_bytes{endpoint="10.209.36.67:9001/csv/xcset/ib_basic_debug"} 4726.0 # HELP telemetry_response_time_seconds Response time of the last telemetry request in seconds # TYPE telemetry_response_time_seconds gauge telemetry_response_time_seconds{endpoint="10.209.36.68:9001/csv/xcset/ib_basic_debug"} 0.028893 telemetry_response_time_seconds{endpoint="10.209.36.67:9001/csv/xcset/ib_basic_debug"} 0.07777 # HELP telemetry_response_process_time_seconds Processing time of the last received telemetry response in seconds # TYPE telemetry_response_process_time_seconds gauge telemetry_response_process_time_seconds{endpoint="10.209.36.68:9001/csv/xcset/ib_basic_debug"} 0.00455 telemetry_response_process_time_seconds{endpoint="10.209.36.67:9001/csv/xcset/ib_basic_debug"} 0.003142Attribute Description num_of_streamed_ports_in_last_msg # of processed ports in the last streaming interval num_of_processed_counters_in_last_msg # of processed counters/attributes in the last streaming interval streaming_time_seconds Time period for last streamed message in seconds telemetry_expected_response_size_bytes Expected size of the last recivied telemetry response in bytes telemetry_received_response_size_bytes Actual size of the last recivied telemetry response in bytes telemetry_response_time_seconds Response time of the last telemetry request in seconds telemetry_response_process_time_seconds Processing time of the last recivied telemetry response in seconds
The below charts present the total processing and streaming time for various sets of ports & counters,it does not include the real telemetry response time for requesting the data:
Tag summary
Content type
Image
Digest
sha256:cc1becfeb…
Size
68.5 MB
Last updated
2 months ago
docker pull mellanox/ufm-plugin-tfs